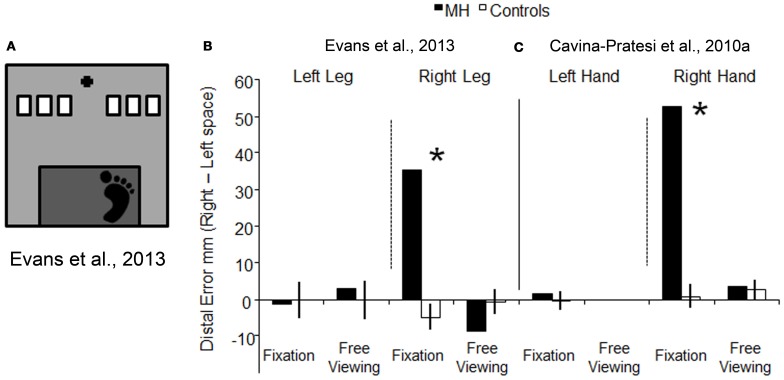
Figure 5.
Schematic representation of the set-up used for testing reaching with the lower limb, and a comparison between the results obtained with lower vs. upper limbs. (A) is a schematic representations of the set-up used Evans et al. (2013). The black cross depicts the fixation point, the white rectangles show the possible target locations (only one target at a time was presented), and the dark gray rectangle indicates the edge of the step from which participants stepped down to make a “leg-reach.” Graph (B) represents the reaching error (the distance between the target and the landing position of the foot) for the left and right leg in conditions of fixation and free viewing, for both M.H. (in white) and age-matched controls (in black). Data have been plotted by subtracting the error in left space from the error in right space. (C) depicts the error for the upper limbs (arm) showed in graph 3b, by subtracting reaching errors made in the left visual field from errors made in the right visual field [this allows a direct comparison between the errors made with the leg in (B) and the arm in (C)]. Reaching errors executed in free viewing using the left hand are not depicted as data were not collected for that condition. For both graphs, the higher the value on the y axis, the greater the reaching error in the right half-field. Asterisks highlight significance differences between M.H. and controls.

