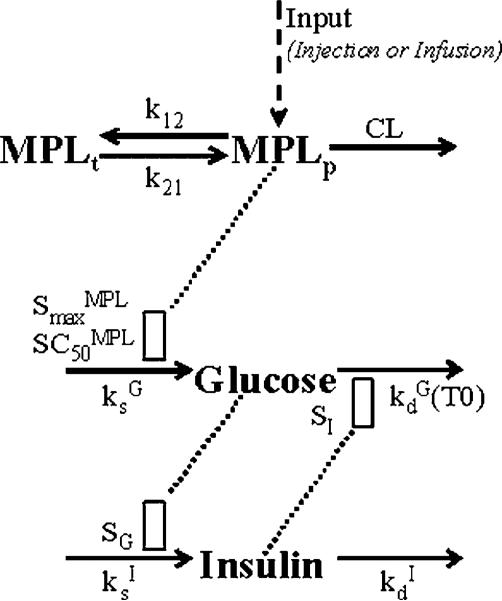
Figure 1.
PK/PD model of MPL effects on glucose regulation. Parameters and differential equations for the model are defined in Equations (1–3), (6–12). The dotted line and open rectangles represent stimulation of the various processes via indirect mechanisms. Symbols are defined in the tables.

