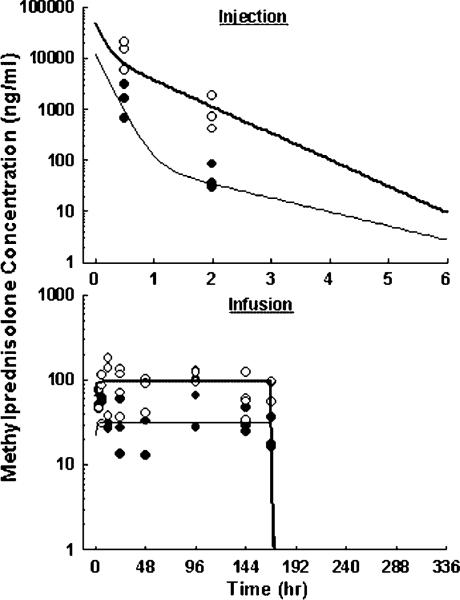
Figure 2.
Pharmacokinetics of MPL upon administration of 10 (●) and 50 (○) mg/kg intravenous injection (top), or 0.1 (●) and 0.3 (○) mg/kg/h subcutaneous infusion for 7 days (bottom). Symbols are observed drug concentrations. Lines in top graph are results of simulation using established parameters. Lines in bottom graph are results of the simultaneous fitting with Equations (1–3). The PK parameters are listed in Table 1.

