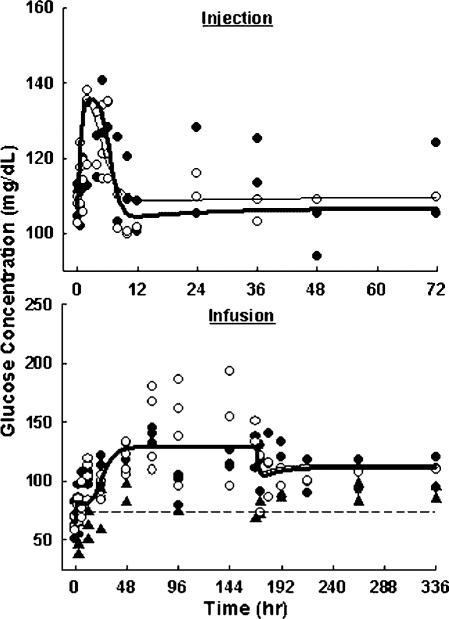
Figure 4.
Plasma glucose versus time profiles upon administration of 10 (●) and 50 (○) mg/kg MPL injection (top), or saline (▲), 0.1 (●) and 0.3 (○) mg/kg/h MPL infusion for 7 days (bottom). Lines are results of the simultaneous fittings of glucose and insulin with Equations (6–12). The PD parameters are listed in Table 3.

