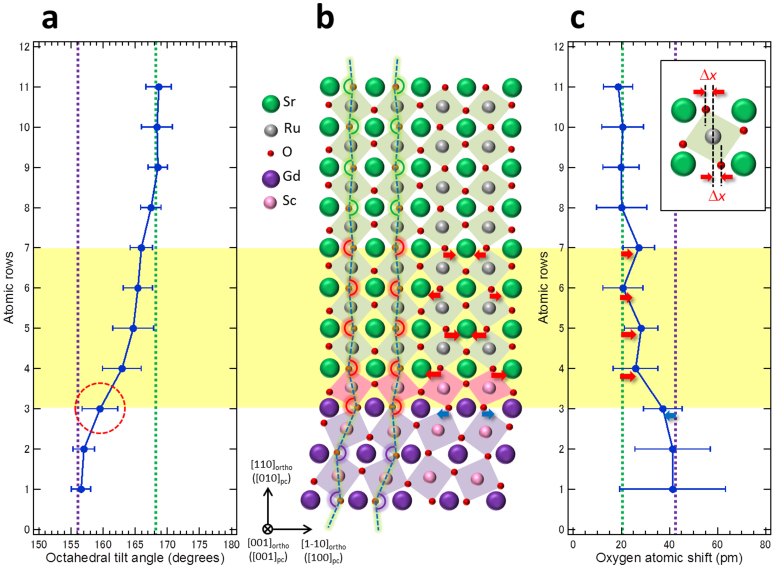
Figure 4. Atomic-scale view of the octahedral distortions due to the structural mismatch accommodation at SRO/GSO heterointerface.
(a), Oxygen octahedral tilt variation extracted from the ABF image in Fig. 2c, where the tilt angles were averaged as an angle below 180° over 18 pseudocubic unit cells along the [1–10]ortho direction (the in-plane direction). The graph shows the octahedral tilt angles θ of the bulk SRO (green dotted line) and GSO (purple dotted line). The error bars show standard deviation with respect to averaging for each lattice layer. In the graph, the red dashed circle indicates the octahedral tilt angle between the topmost and second ScO6 octahedral layers in the GSO substrate. (b), Structural model around the heterointerface between the SRO thin film and GSO substrate projected along the [001]ortho direction. The termination layer of the GSO substrate is a ScO2 layer and the first layer of the SRO epitaxial thin film is a SrO layer, where ScO6 octahedra (pink squares) at the heterointerface share oxygen atoms in the SrO layers. Blue dashed lines represent the oxygen octahedral tilt angles in Fig. 4a. (c), Oxygen atomic shift variation extracted from the ABF image in Fig. 2c, where the oxygen atomic shift Δx is defined as the distance from the middle position between A-site cations along the in-plane direction (as inserted in Fig. 4c). The graph shows the oxygen atomic shifts in the bulk SRO (green dotted line) and GSO (purple dotted line). Red and blue arrows represent the oxygen atomic shifts from that of the bulk SRO and GSO, respectively, the directions of which are shown in Fig. 4b. The yellow box in the vicinity of the heterointerface represents the region where the tilt angle mismatch is accommodated.

