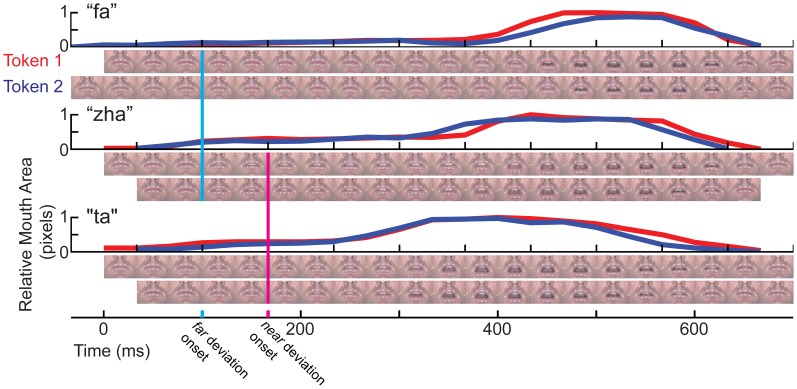
Figure 2.
Temporal kinematics of the syllables. For each syllable, “fa,” “zha,” and “ta,” mouth opening area was measured in pixels, normalized to the range 0 (minimum for that syllable) to 1 (maximum for that syllable). Below each mouth opening graph are two rows of video images, one for each token of the stimulus. The images are cropped to show only the mouth area. The full face was shown to the participants in gray-scale. The vertical line in cyan marks the time of deviation for “zha” vs. “fa.” The magenta vertical line marks the time of deviation for “zha” vs. “ta.”

