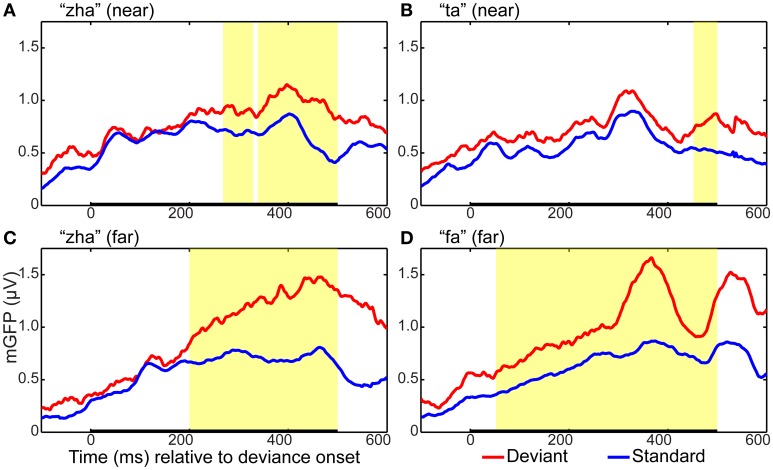
Figure 3.
Global field power plots for the four vMMN contrasts. Group mean global field power (mGFP) evoked by the standard and the deviant are shown for (A) “zha” in the near context, (B) “ta” in the near context, (C) “zha” in the far context, and (D) “fa” in the far context. The time axes show time relative to the onset of stimulus deviation. Highlighted regions show times of statistically significant difference (p < 0.05) between standard and deviant GFPs, as determined by a permutation test corrected for multiple comparisons over time. Statistical comparisons were performed over the times indicated by the heavy black line along the time axis. This time window was selected to include the expected time for a vMMN evoked by the consonant part of the syllable.

