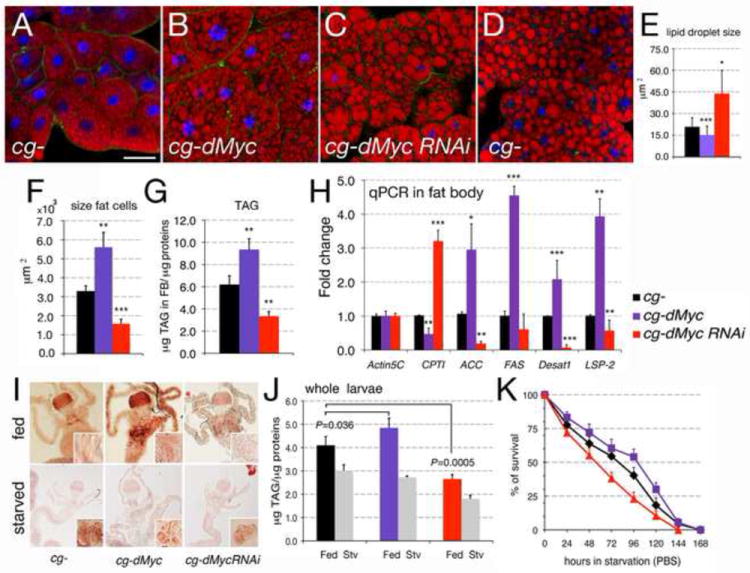
Figure 4. Altered dMyc expression in the FB increases triglycerides (TAG) and confers resistance to starvation.

(A-D) Photographs of FB from third instar larvae of the indicated genotypes. Lipid vesicles are stained with Nile Red, nuclei with DAPI and Alexa-488-Phalloidin to visualize the cell membrane. (E) Size of the vesicles in fat cells was analyzed from photographs (A-C). (F) size of cells in the FB (G) triglyceride (TAG) content in cells from the FB; TAG concentration was normalized to the amount of protein; P-values were calculated from a Student t-test from four independent experiments, 10 larvae in each experiment were used; (H) Quantitative RT-PCR from FB from third instar larvae from cg-control, cg-Myc and cg-dMyc-RNAi animals; actin5C was used as control. *P <0.05, **P <0.01, ***P <0.001; P-values were calculated from Student t-test from at least four independent experiments. (I) Oil red O staining of midgut, caeca, and oenocytes (insets) dissected from larvae of the indicated genotype fed (upper panel) or starved for 24 hrs in PBS (lower panel). Insets show oenocytes stained with Nile Red. (J) Content of triglycerides (TAG) was normalized per protein concentration in whole larvae in feeding and after starvation in PBS. P-values were calculated from Student t-test from at three independent experiments. (K) Age-matched late L2 larvae were transferred in PBS, and larval viability was calculated every 12 hours. cg-dMyc larvae show resistance to starvation when compared to cg-control animals, while cg-dMyc-RNAi die early. P<0.001 in a z-test for the survival rate between the three genotypes (see Appendix-1 for calculation). Error bars represent the standard deviations.
