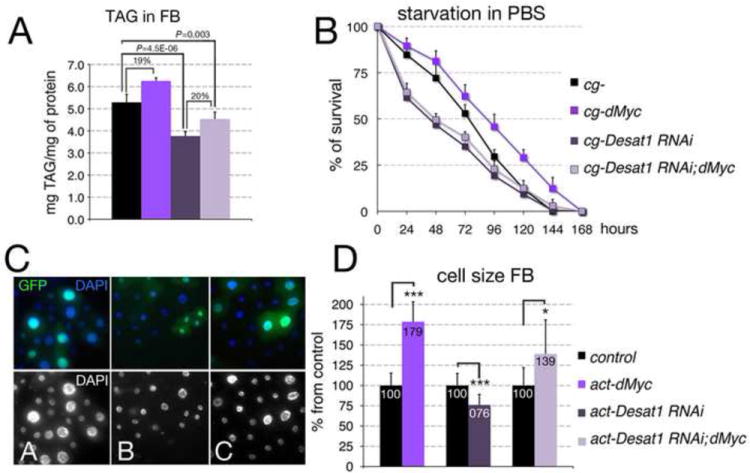
Figure 6. Reduction of Desat1 affects dMyc’s ability to accumulate TAG and to increase the cell size in the FB.

(A) Triglyceride (TAG) content in cells from FBs of the indicated genotype; TAG concentration was normalized to the amount of protein; P-values were calculated from a Student t-test from three independent experiments, 10 larvae per genotype were used in each experiment. (B) Age-matched late L2 larvae were transferred in PBS, and larval viability was calculated every 12 hours. P-values from a Student t-test from three independent experiments P<0.001 was calculated for cg-control and cg-dMyc at all time points. cg-Desat1 RNAi and cg-Desat1 RNAi; dMyc animals are significantly smaller then cg-control animals (P<0.001), while no significant difference was found between cg-Desat1 RNAi and cg-Desat1 RNAi; dMyc (P>0.05). Error bars represent the standard deviations. (C) Actin flip-out clones in FB expressing dMyc (A), Desat1RNAi (B) or Desat1-RNAi; dMyc are marked with GFP, nuclei are stained with DAPI, lower panel is only DAPI. (D) Numbers represent the size of cells from flip-out clones in FB; size is expressed as % of the control wild-type GFP negative cells surrounding the clones (100). *P <0.05, **P <0.01, ***P <0.001; P-values were calculated from Student t-test from at least 40 cells. Error bars represent the standard deviations.
