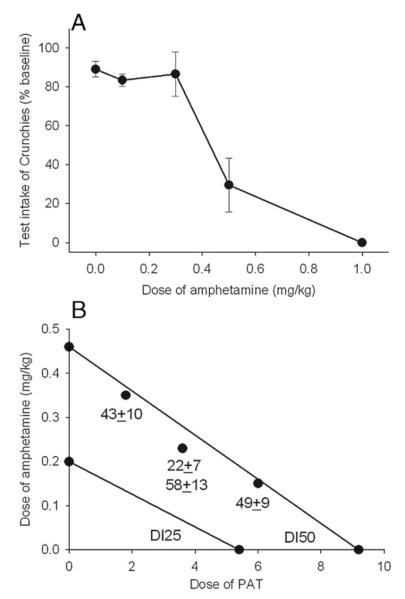
Fig. 2.
Panel A: Dose–effect curve amphetamine on 30 min intake of Crunchies by non-deprived mice. Each point is the mean±SE of 6 or more observations. Panel B: DI25 and DI50 isobolograms for combinations of amphetamine and (−)-trans-PAT, determined from regression of the individual drug data. The points shown are specific combinations that were tested and the numbers beneath are the observed intakes (mean±SE; Ns 8 or more).

