Fig. 1.

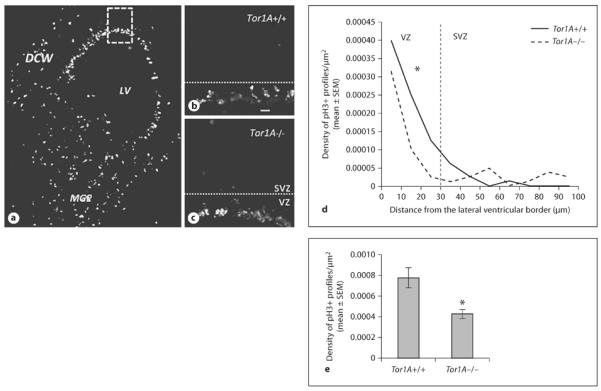
Photomicrographs of pH3-labeled profiles in coronal sections of E15 Tor1A+/+ and Tor1A−/− mice. a Low-magnification image from an E15 Tor1A+/+ forebrain, showing pH3+ profiles in the DCW and the MGE encircling the LV. The boxed area in a outlines the presumptive prefrontal cortex, and is shown at higher power for representative Tor1A+/+ (b) and Tor1A−/− (c) sections. The dotted lines in b and c represent the approximate border between the VZ and SVZ. The numerical density of pH3+ profiles was calculated at 10-μm intervals between the ventricular border and the pial surface (d). The numerical density in the VZ of the DCW was lower in Tor1A−/− mice compared to Tor1A+/+ littermates (e). * p < 0.05, error bars indicate SEM.
