Fig. 2.
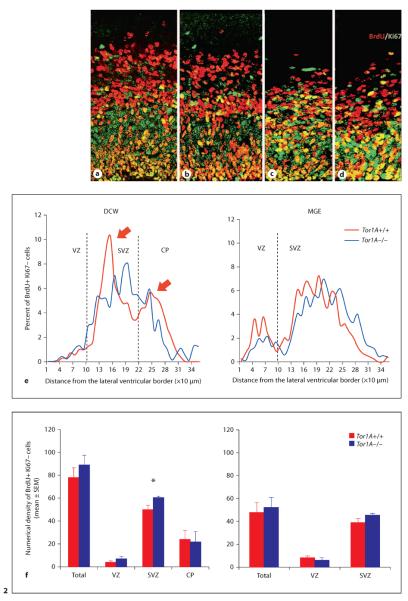
Quantification of cell output from the DCW (a, b (c, d) of E15 Tor1A+/+ and Tor1A−/− mice using the BrdU-Ki67 double-labeling method. BrdU+Ki67− cells (red) are postmitotic and represent the cell output fraction. BrdU−Ki67+ cells (green) and BrdU+Ki67+ cells (orange/yellow) are proliferating precursor cells. Number of postmitotic cells (red, black in the printed version) per bin as a percentage of total is plotted against the distance from the ventricular border at 10-μm intervals in the DCW and MGE (e). Arrows in e point to the two peaks in the distribution of postmitotic cells in the Tor1A+/+ embryo. The two peaks are not apparent in the distribution of postmitotic cells in the Tor1A−/− embryo. Numerical density (per 1,000 μm2) of postmitotic cells within the different zones of the cerebral wall is shown for DCW and MGE (f). The broken lines in e represent approximate boundaries between VZ and SVZ, and SVZ and CP. * p < 0.05, error bars indicate SEM. Colors refer to the online version only.

