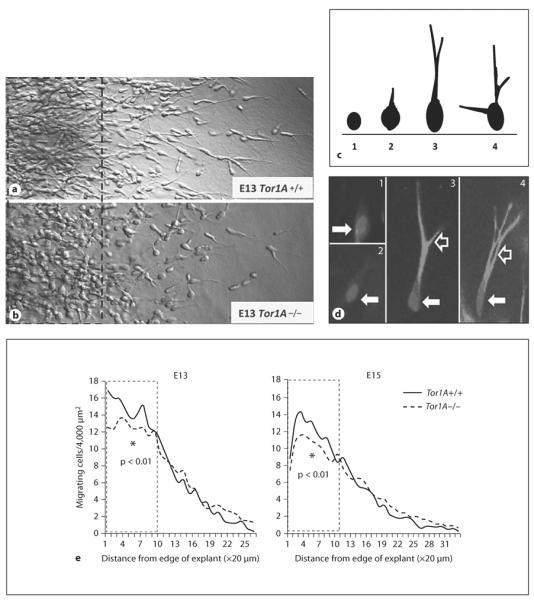
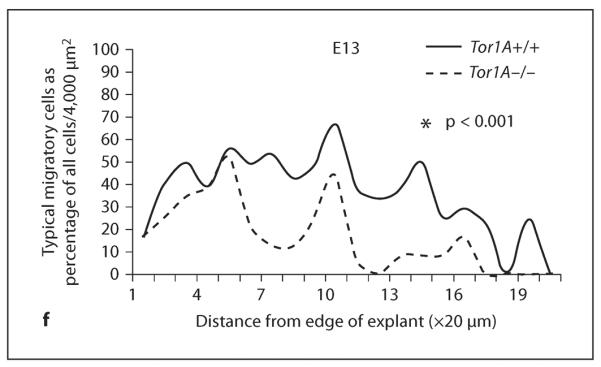
Fig. 4.


Cell migration in explants of the medial ganglionic eminence of the basal forebrain obtained from E13 and E15 Tor1A+/+ and Tor1A−/− embryos. Explants were cultured in Matrigel for about 24 h. Cells have migrated away from the edge of the explant (on the left of the images) taken from Tor1A+/+ (a) and Tor1A−/− (b) embryos. Broken lines in a and b represent 200 μm distance from the explant edge. c A diagrammatic illustration of the diverse morphologies of migrating cells. The morphologies ranged from rounded cells without a process (1) to cells with elongated cell bodies and multiple well-defined leading processes (4). Intermediate morphologies (2, 3) were also observed. For analysis of migrating cell morphology, cells with morphologies represented in 2, 3 and 4 were considered cells with typical migratory cell morphology, whereas cells with the morphology shown in 1 were considered cells without the typical morphology. Examples of the different cell types are shown in d, where 1 and 2 show cells with morphology depicted in c1, and 3 and 4 show cells with morphologies depicted in c3 and c4. The solid white arrows in d point to cell bodies and the open white arrows point to processes. e The number of migrating cells and (cells with morphological features shown in d2, 3 and 4) as a percentage of all cells (i.e. cell types shown in d1–4) were plotted as a function of distance from the edge of the explant (in 20 μm increments). There are fewer migrating cells within 200 μm from the explant edge in the Tor1A−/− explants compared to Tor1A+/+ explants at E13 and E15 (e). The distribution of cells with typical migrating cell morphology as a percentage of all cells was significantly different between E13 Tor1A−/− and Tor1A+/+ explants. * p < 0.01 Tor1A+/+. f The percentage of cells with migrating cell morphologies.
