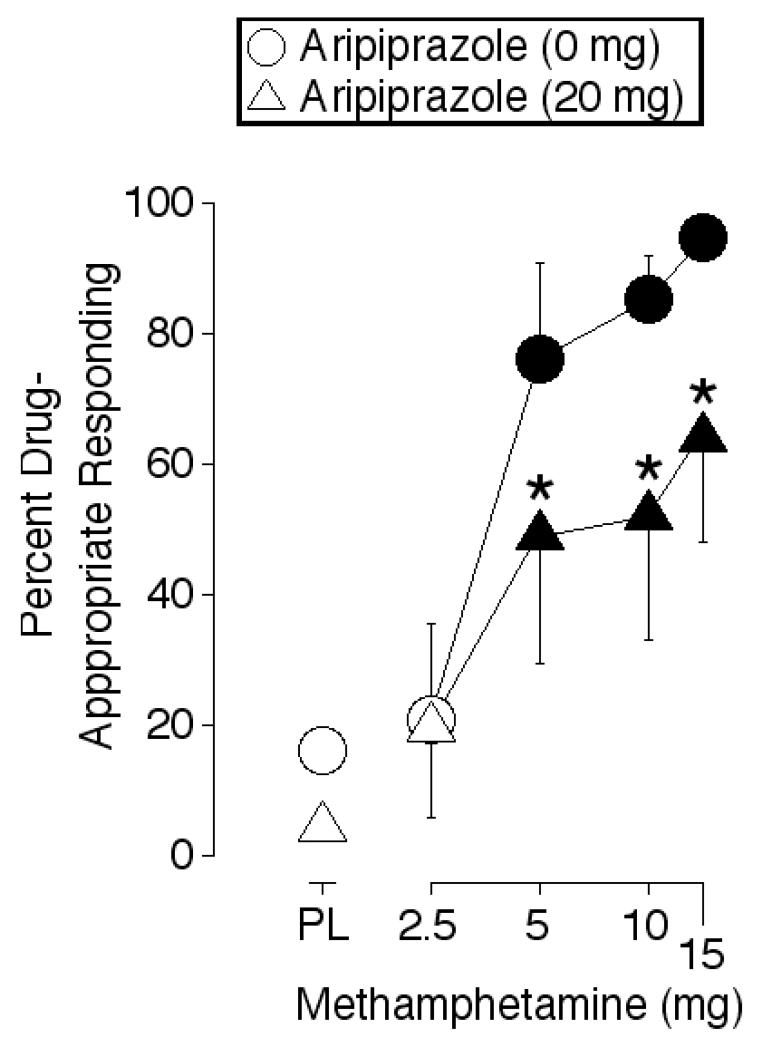
Figure 1.
Percent drug-appropriate appropriate responding maintained by methamphetamine alone, aripiprazole alone, methamphetamine-aripiprazole combinations, and placebo. Data are expressed as area-under-the-time-action curve (AUC). X-axes: methamphetamine dose. Data points above PL represent values when the doses of aripiprazole were administered in combination with 0 mg methamphetamine. Data points above 2.5, 5, 10 and 15 represent the effects of the methamphetamine dose administered in combination with 0 mg (circles) or 20 mg (triangles) aripiprazole. Data points show means of six participants. Filled symbols indicate those values that are significantly different from the placebo-placebo condition (i.e., circle above PL). An asterisk indicates a significant difference between the 0 and 20 mg aripiprazole conditions at the indicated methamphetamine dose.

