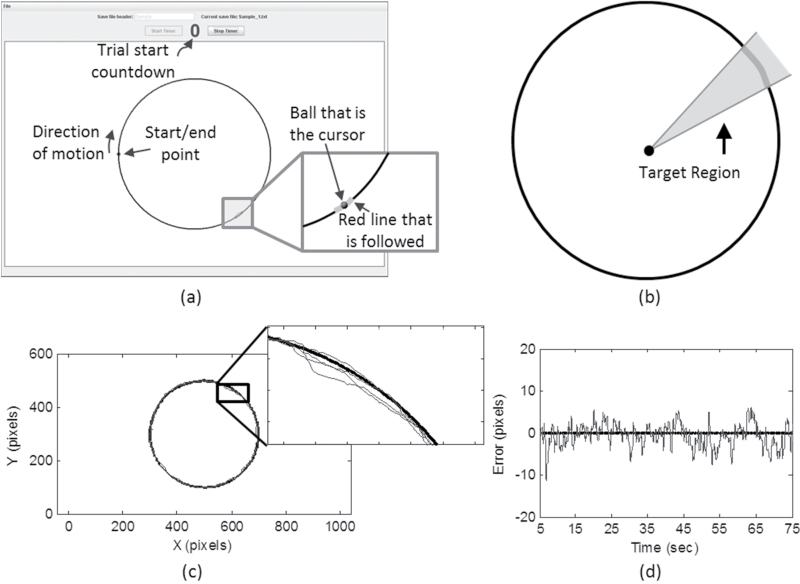
Figure 1.
(a) Screenshot of the visuomotor-tracing task. The participants controlled the cursor, represented as a ball, with a stylus. The goal was to stay within the moving red line. (b) Rays are drawn from the center of the circle to the boundaries of the moving target at each time point to define the target region for data analysis (not shown to scale). (c) Sample data for the tracing task and (d) the associated error signal. Pixels were 0.008×0.008 in (0.020×0.020cm).

