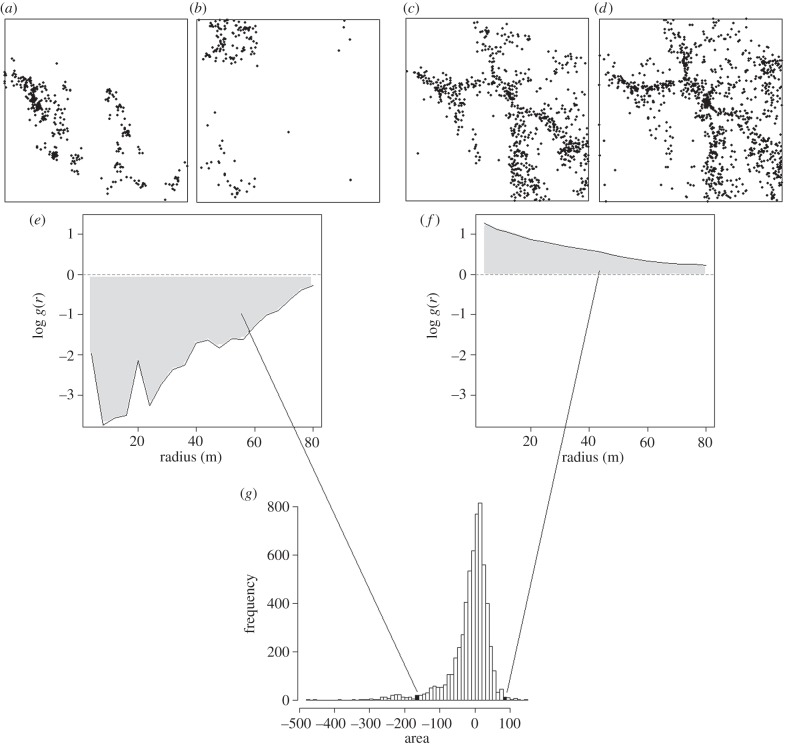
Figure 1.
The contribution of species pairs to the xPOD for Lienhuachih. (a,b) The locations of all individuals of two species that are clearly separated in space, and (e) have a log cross-pair correlation function below zero at all radii. (c,d) The locations of two further species that clearly overlap in space, both occurring along ridgelines. (f) These species have a log cross-pair correlation function above zero. As a result, the areas (Aij) under these functions are negative and positive, respectively (shaded). These two Aijs contribute as indicated to the full set of Aijs representing all possible species pairs on the Lienhuachih plot, which together give (g) the complete xPOD for Lienhuachih.

