
Figure 2.
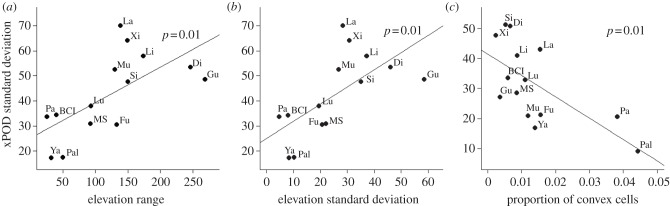
Significant relationships between cross-pair overlap distribution standard deviations and environmental metrics. Fitted regression lines and their associated p-values are shown in (a-c). The relationships in (a) and (b) are at a species abundance threshold of 100, while the relationship in (c) is at a threshold of 500. Plots are identified as follows: BCI, Barro Colorado Island; Di, Dinghushan; Fu, Fushan; Gu, Gutianshan; La, Lambir; Li, Lienhuachih; Lu, Luquillo; MS, Mo Singto; Mu, Mudumalai; Pa, Pasoh; Pal, Palanan; Si, Sinharaja; Xi, Xishuangbanna; Ya, Yasuni.