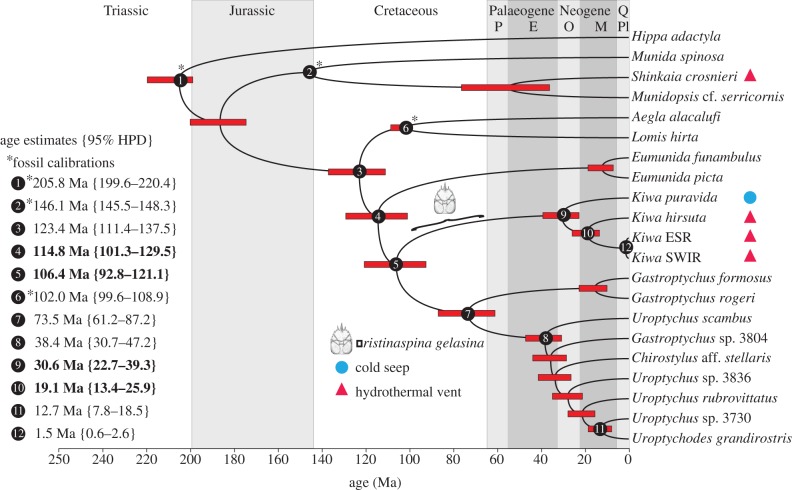
Figure 4.
Divergence time estimates for the nine-gene concatenated dataset with nine partitions as calculated with a relaxed lognormal clock on Beast v. 1.7.4. Node bars represent the 95% highest posterior density (HPD) interval for nodal age. Numbered nodes show dates of interest to this study and quoted age values show median age estimates followed by the 95% HPD ranges in parentheses. Dates highlighted in bold are of particular interest. Nodes marked with an asterisk are fossil calibrated. Carapace illustration of the fossil Pristinaspina gelasina shows the date range for the fossil. Geological periods are shown at the top, with recent epochs represented as letters: P, Palaeocene; E, Eocene; O, Oligocene; M, Miocene; Pl, Plio-Pleistocene. Q, Quaternary. (Online version in colour.)

