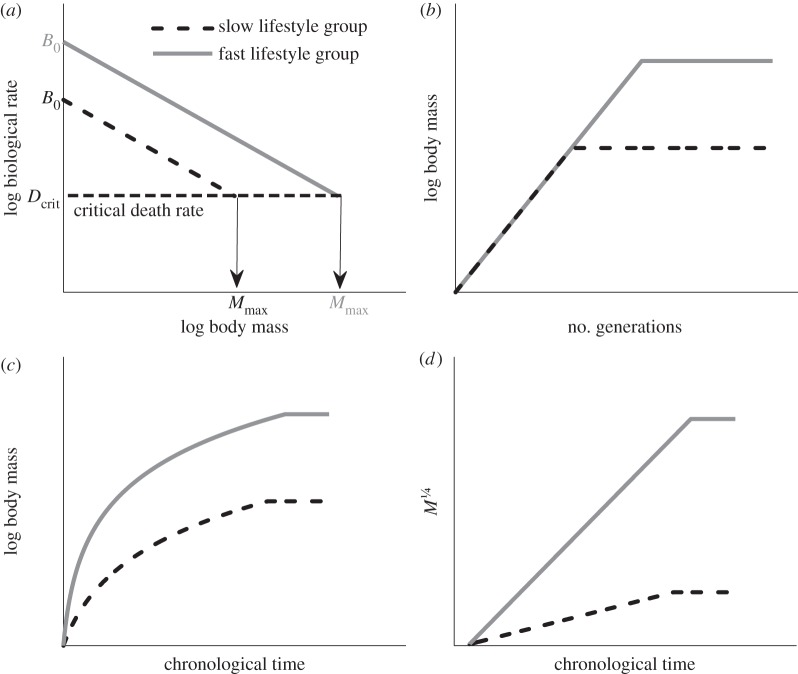
Figure 1.
Schematic of theory. (a) Mass-specific production rate B (diagonal lines) plotted against body mass for slow and fast lifestyle groups. The logarithm of the normalization coefficient B0 is given by the intercept with the y-axis. The dashed horizontal line represents the critical death rate referred to in predicting maximum body sizes. (b) Exponential trajectories of body mass in biological time (generations) for adaptive radiations involving a constant per-generation rate of evolution until an asymptotic maximum body size is reached. When the per-generation rate of evolution, α, is the same for the two groups, the trajectories of log body mass plotted against time in generations have the same initial slope. (c) These trajectories of log body mass are decelerating in chronological time because generation time increases with increasing size. The two curves represent the fast and slow lifestyles shown in (a) and (b), which have the same initial body mass but attain different maximum sizes. (d) By scaling the size axis as M1/4, trajectories of M1/4 plotted in chronological time are initially straight lines with slopes providing a measure of evolutionary rate, as given by equation (2.5). In chronological time, both the slope and maximum for fast, productive lifestyles are higher than those for slow, unproductive lifestyles.

