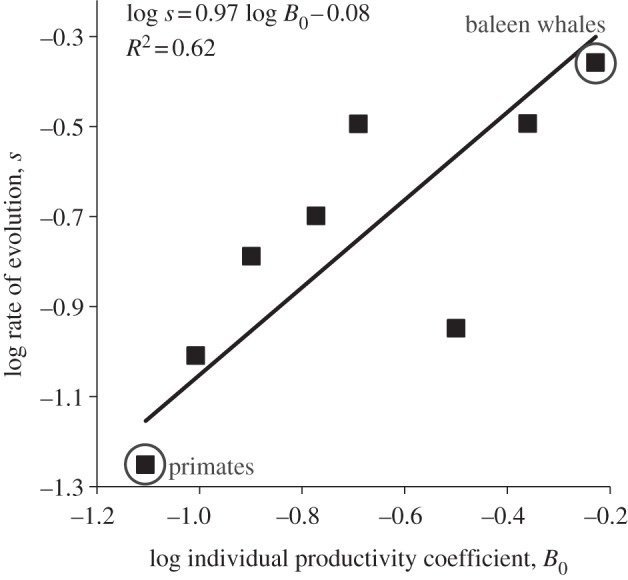
Figure 3.

The effects of the individual productivity of a lifestyle, as quantified by a taxon's normalization coefficient B0, on the rate of size evolution s in mammalian clades. The data are shown in the electronic supplementary material, appendix table S2. Theory predicts a positive linear relationship (equation (2.5)) between a clade's evolutionary rate and its mass-specific production normalization coefficient, which quantifies a clade's position along the slow–fast lifestyle continuum. The data points for the primates and baleen whales are circled.
