
Figure 2.
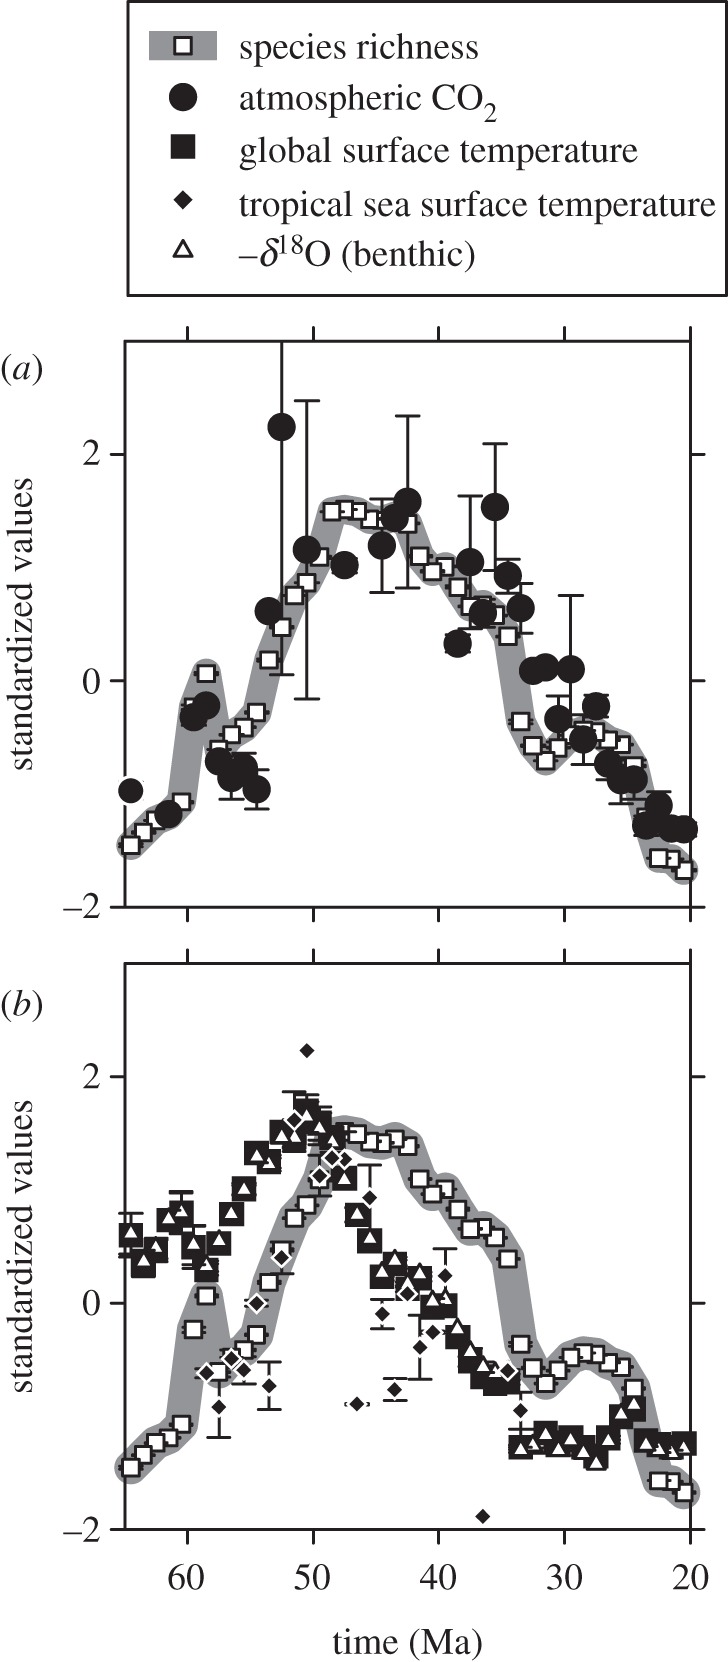
Standardized temporal patterns in pollen morphospecies richness, atmospheric CO2 and temperature. Each data point is the mean of a 1 Myr time-step, then transformed to a z distribution (series mean = 0 and s.d. = 1). Bars represent standard errors of the mean (many are smaller than the symbols). Species richness data are identical in (a,b).