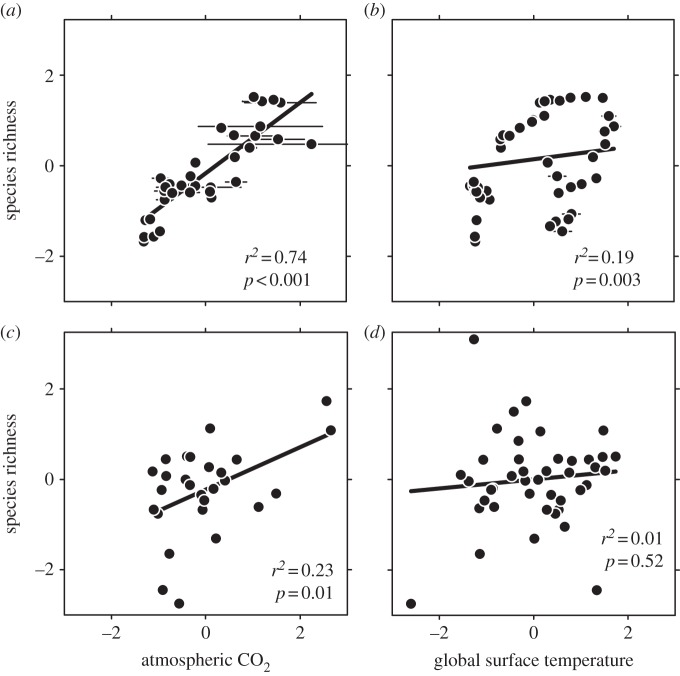
Figure 3.
Crossplots of atmospheric CO2 and global surface temperature against pollen morphospecies richness. (a,b) Standardized scores (identical to data in figure 2). Bars represent standard errors of the mean (both for x-axis and y-axis; many are smaller than the symbols). (c,d) Standardized first-difference scores. First differences are computed from the data in figure 1, then transformed to a z distribution (series mean = 0 and s.d. = 1). Type II regressions and their associated p-values are plotted in all panels; companion r2 values come from a bootstrap approach (see also table 1).

