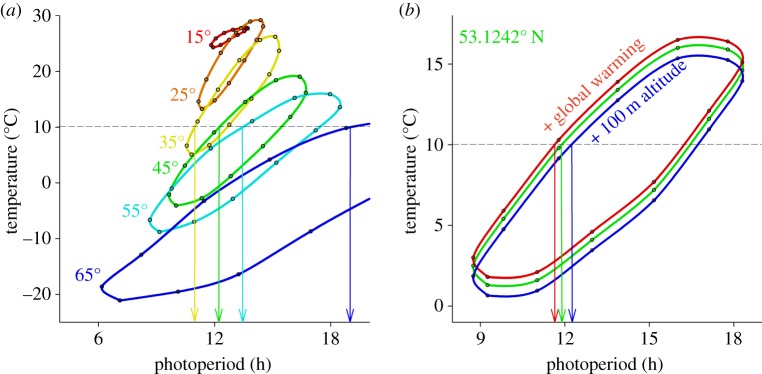
Figure 2.

Ellipse-like annual PPT curves predict changing photoperiodic responses with changing latitude and altitude. (a) The annual temperature hysteresis leads to an ellipse-like relationship between temperature and photoperiod, with higher temperatures in autumn than in spring (dots indicate the mid-point of each month). The dotted lines (a,b) indicate a hypothetical threshold temperature at 10 °C at which a certain species starts winter dormancy (e.g. diapause), resulting in a shift towards longer critical photoperiod (CPP) earlier in the year when this species moves north. This fundamental process forms the basis for the expectation that latitudinal clines in photoperiodic response mechanisms may exist in nature. (b) Global warming (by 0.5 °C) will shift PPT ellipses up, whereas altitude will shift PPT ellipses down (by 0.649 °C 100 m−1). The photoperiod–diapause reaction norm (and accompanying CPP) is therefore expected to evolve under these environmental selection pressures (latitude, altitude and global warming).
