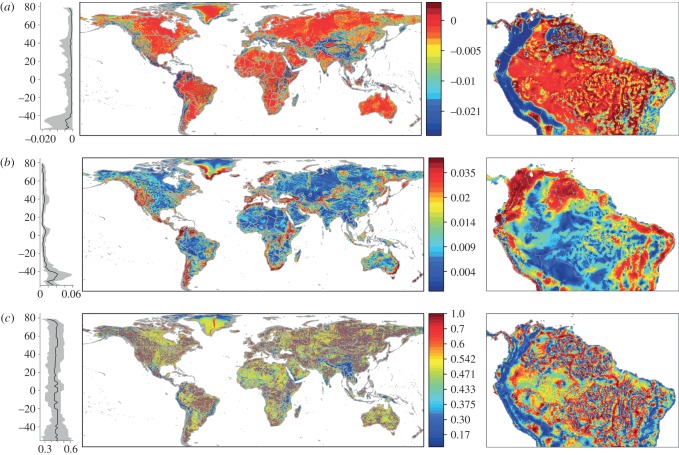
Figure 2.
The (a) mean and (b) maximum of the fitness advantage in 2100 of movement within a 50 km radius. We also depict (c) the proportion of moves that would result in a fitness increase. Data are divided into quantiles with red representing higher values and latitudinal patterns (25%, 50% and 75% quantiles) are additionally depicted. The advantages of moving differ in northern South America between the topographically diverse Andes Mountains and the flatter Amazon Basin. (Online version in colour.)

