
Fig. 1.
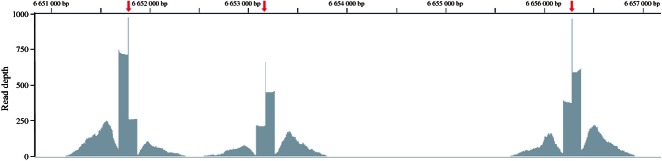
Characteristic pileup of RAD-Seq data. Three PstI restriction sites (red arrows) in Caenorhabditis elegans chromosome I (6.651 Mb–6.657 Mb) are covered both upstream and downstream by RAD-Seq raw reads (dark grey). Read 1 sequences are piled up in stacks either side of each restriction site; read 2 sequences are spread out in heaps up to 700 bp beyond the restriction site. The restriction site overhang TGCA is covered by reads belonging to both upstream and downstream RAD loci, producing narrow peaks of read coverage at the restriction sites. RAD loci on either side of a restriction site have different read depths; however, loci from the same restriction fragment have similar read depths. Bases in the read 2 regions are covered at much lower depth overall; read 2 sequences also partially cover the read 1 regions, as seen by the increase in read depth at bases towards the end of read 1 regions.