
Fig. 6.
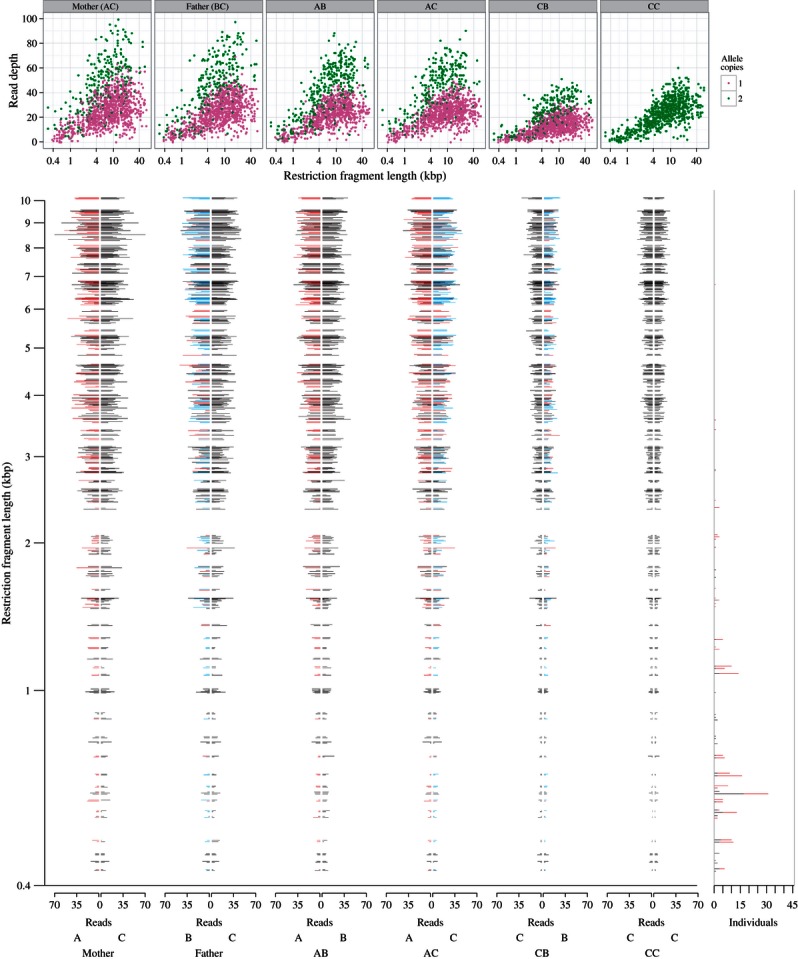
Effect of restriction fragment length bias on missing data and genotyping. Top panel, Heliconius RAD loci exhibit restriction fragment length bias in read depth. Six individuals are shown from the cross: two parents (Mother, genotype AC and Father, genotype BC) and four offspring with each of the four possible F2 genotypes AB, AC, CB and CC (see Fig. 5 for description of haplotypes A, B and C). Individuals vary in overall read depth because of variation in input DNA quantities. Read depths for unique alleles are shown, where allele counts can be 2 (for two-copy alleles at homozygous loci) or 1 (for single-copy alleles at heterozygous loci). Bottom panel, left, read depths for individual allele copies in all individuals vary according to total individual read depth and restriction fragment length. Each RAD locus has two alleles per individual, with read depth per haplotype shown by the length of line extending left or right from centre from 0 to 70 reads. Allele variations at RAD loci are shown in black, red and blue, as per Fig. 5. RAD loci with equal restriction fragment lengths below 10 kb for all haplotypes are shown. Bottom panel, right, genotype accuracy for all 47 individuals in mapping cross for each RAD locus. Black bars, number of individuals with no data for a locus; red bars, number of individuals at heterozygous loci with one of two alleles missing, leading to an incorrect homozygous call.