
Figure 3.
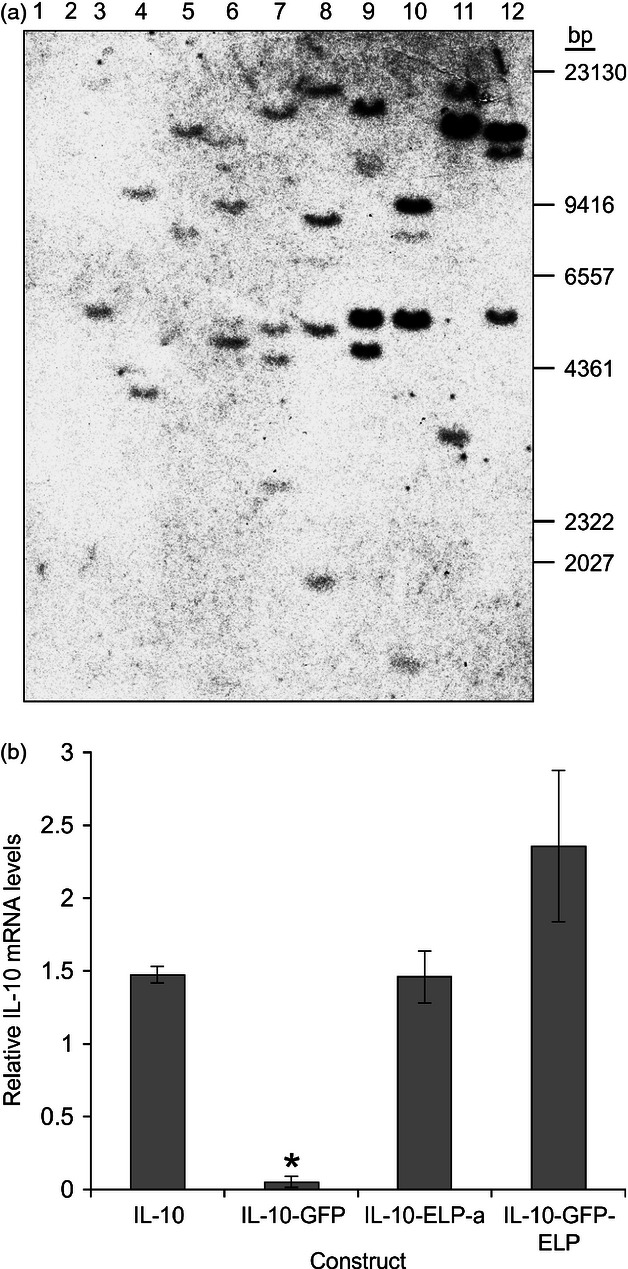
IL-10 gene copy number and steady-state mRNA levels in transgenic BY-2 cell lines. (a) Southern blot analysis of stable transgenic BY-2 cell lines. 10 μg of genomic DNA digested with BamHI (odd numbered lanes) and EcoRI (even numbered lanes). Lanes 1 and 2, wild-type BY-2 genomic DNA; lanes 3 and 4, IL-10; lanes 5 and 6, IL-10-ELP-a; lanes 7 and 8, IL-10-ELP-b; lanes 9 and 10, IL-10-GFP; and lanes 11 and 12, IL-10-GFP-ELP. (b) Quantitative RT-PCR was performed to determine the relative IL-10 transcript levels present in transgenic BY-2 cells. IL-10 mRNA levels were expressed as a ratio of actin and α-tubulin reference genes. Significant differences (P < 0.05) are indicated (*). Error bars represent the standard error of the mean.