Figure 9.

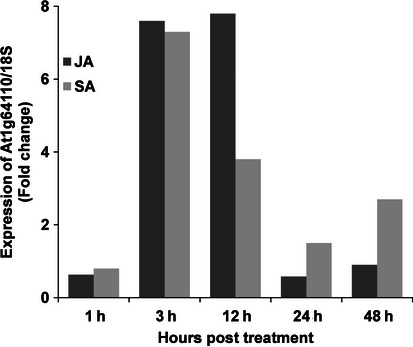
Relative expression of the At1g64110 gene in response to MeJA (100 μM) and SA (1 mm). The graph shows the results for one of two experiments with similar results.

Relative expression of the At1g64110 gene in response to MeJA (100 μM) and SA (1 mm). The graph shows the results for one of two experiments with similar results.