Figure 12.

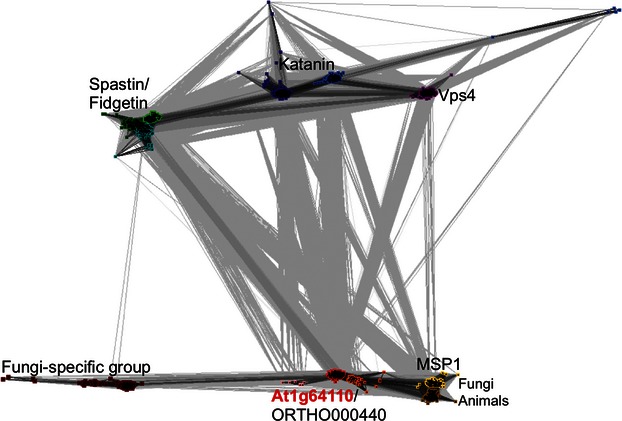
Cluster analysis of the ‘meiotic clade’ of AAA proteins. The cluster map illustrates the relationships of proteins belonging to the meiotic clade of AAA proteins (Frickey and Lupas, 2004b). The map contains 1734 sequences, each of which is represented by a dot. Pairwise similarities of the conserved AAA domain of all sequences were calculated using BLAST (Altschul et al., 1997). Sequences were clustered using CLANS (Frickey and Lupas, 2004a) using similarities with P values < 1.0e-50. Darker lines between two dots indicate lower BLAST P values. The At1g64110/ORTHO000440 cluster (red dots) shows the tightest connections to MSP1 proteins from fungi and metazoa (yellow dots). However, the Spastin (green), Katanin (blue) and Vps4 (purple) clusters also show strong similarities to the At1g64110/ORTHO000440 (red) group.
