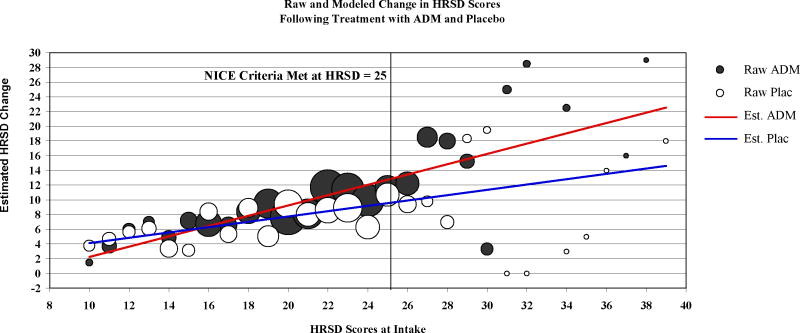
Figure 2.
Circles represent raw mean change in depressive symptoms from intake to the end of treatment at each initial HRSD score for both the antidepressant medication (ADM) and placebo (Plac) conditions. The size (area) of the circle represents the number of data points that contributed to each mean. The regression lines represent the estimates of change in depression symptoms from intake to the end of treatment for ADM and Plac conditions as a function of baseline symptom severity. These regression lines were estimated from a model of the baseline severity-by-treatment interaction, controlling for the effects of the study from which the data originated.

