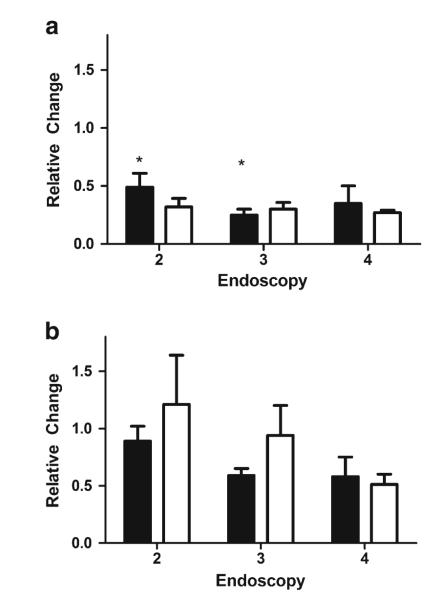
Fig. 5.
Relative change in CYP3A activity based on CYP3A5 genotype. The relative change in intestinal (a) and hepatic (b) CYP3A activity was assessed in CYP3A5 high expressers (n=4, white bars) and low expressers (n=8, black bars). Data are presented as the mean ± SE. *p=0.046 compared to baseline activity

