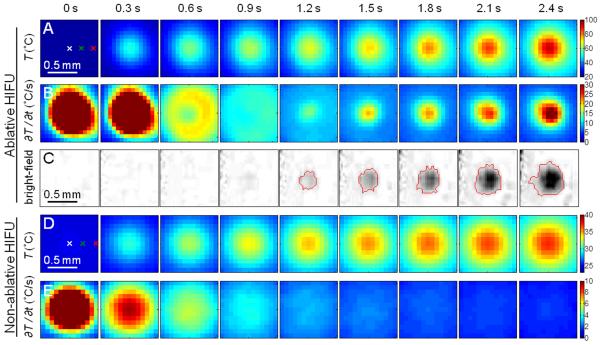
Figure 3.
(A – C) Ablative HIFU exposure with focus placed at the surface: Zoomed-in images of the first 2.4 s in Fig. 2 showing (A) IR images of the surface temperature T (°C), (B) images of the rate of temperature change ∂T/∂t (°C/s), and (C) processed bright-field images of the tissue surface showing lesion formation. The red line indicates the lesion boundary. (D – E) Non-ablative HIFU exposure with focus placed at the surface: The first 2.4 s during a non-ablative HIFU exposure (283 W/cm2, 5 s duration) showing (D) IR images of T (°C) and (E) images of ∂T/∂t (°C/s).

