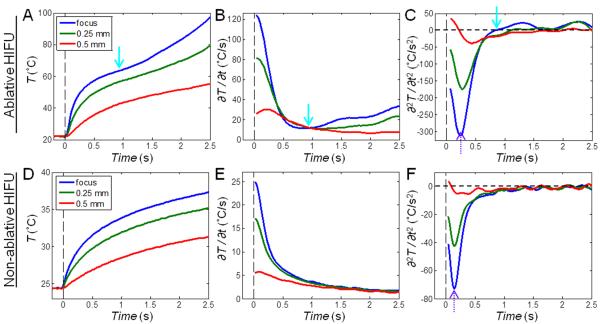
Figure 4.
Time evolution of temperature T (°C), the rate of temperature change ∂T/∂t (°C/s), and the second derivative of temperature change ∂2T/∂t2 (°C/s2) corresponding to Fig. 3. The points at the focus and 0.25 mm and 0.5 mm to the right of the focus are shown (indicated on the first IR image in Figs. 3A and 3D). (A – C) Ablative HIFU exposure: Extra heating is indicated by the solid cyan arrows at 0.8 – 1 s when lesion starts to form. (D – F) Non-ablative HIFU exposure: ∂T/∂t continues to decrease without any reversal. The dotted purple arrows indicate the time point when ∂2T/∂t2 reaches its minimum value.

