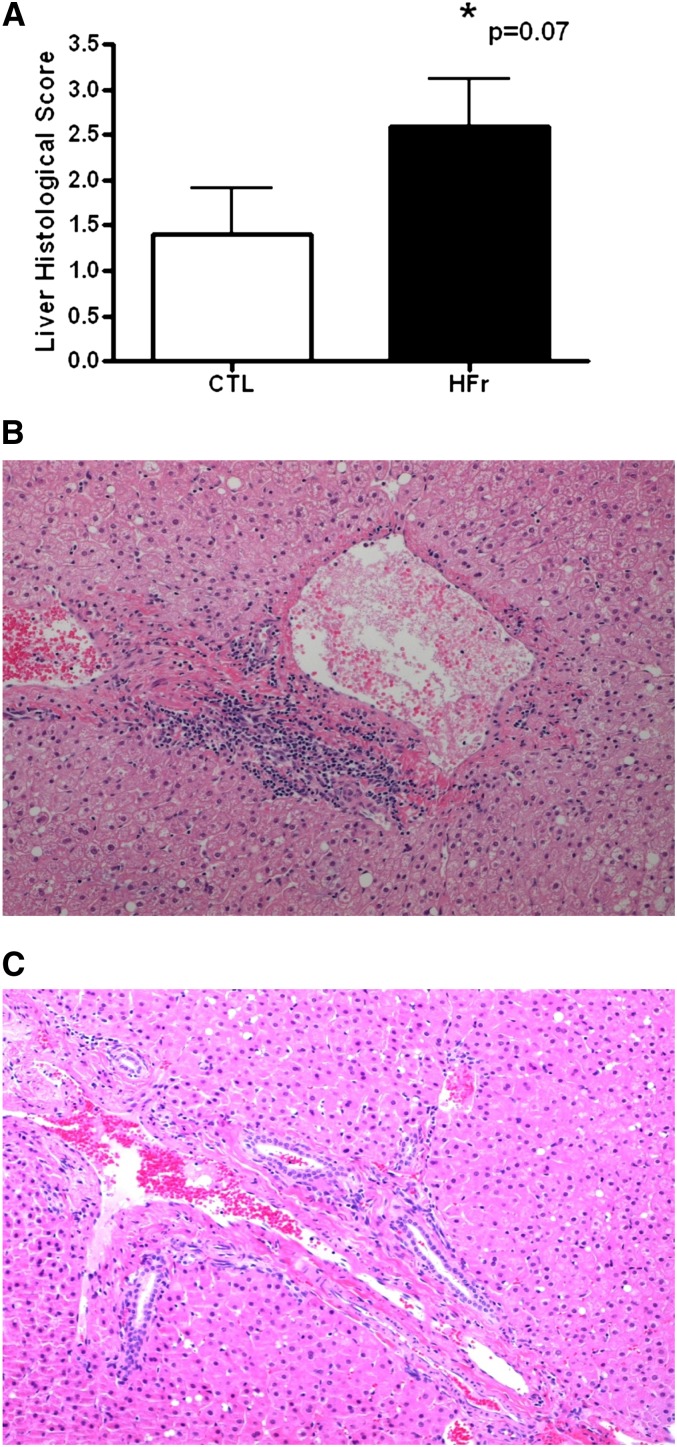
FIGURE 2.
A: Mean (±SEM) scores for liver pathology as assessed by histologic grading for inflammation from monkeys fed either a CTL (n = 5) or HFr (n = 5) for 6 wk. An ANCOVA P value is shown. B: Representative histologic section from a monkey fed the HFr (histologic score: 3) showing the periportal inflammatory infiltrate seen in fructose-fed monkeys. C: Representative histologic section from a liver biopsy taken from a CTL monkey (histologic score: 0). CTL, low-fat, low-fructose diet; HFr, low-fat, high-fructose diet.

