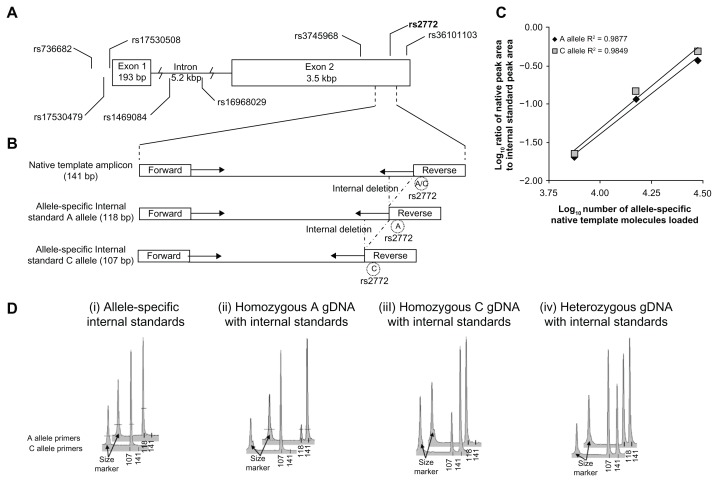
Figure 1.
CEBPG allele-specific competitive PCR primer design and performance. (A) Schematic of CEBPG gene including location of polymorphic site rs2772 (A/C alleles) used for allele-specific priming and seven nearby putative cis-functional polymorphic sites. (B) Schematic of native template and internal standard template for each allele at rs2772, with position of forward and reverse primers. The internal deletions in A allele and C allele internal standards were generated through PCR using reagents presented in supplementary materials online. (C) Plot of the ratio of Native Template to Internal Standard Peak area versus number of Internal Standard Molecules loaded for Electropherograms that were within a 1:10 to 10:1 ratio of peak areas. (D) Representative electropherograms of PCR reaction products. Top row of electropherograms = A allele-specific primers (CEBPG rs2772 F1 with CEBPG rs2772 R-A3) and internal standard. Bottom row = C allele specific primers (CEBPG rs2772 F1 with CEBPG rs2772 R-T3) and internal standard. Numbers below electropherogram peaks are in units of base-pairs. Amplicon sizes: A and C allele native amplicons each = 141 bp; A allele internal standard amplicon = 118 bp; C allele internal standard amplicon = 107 bp.

