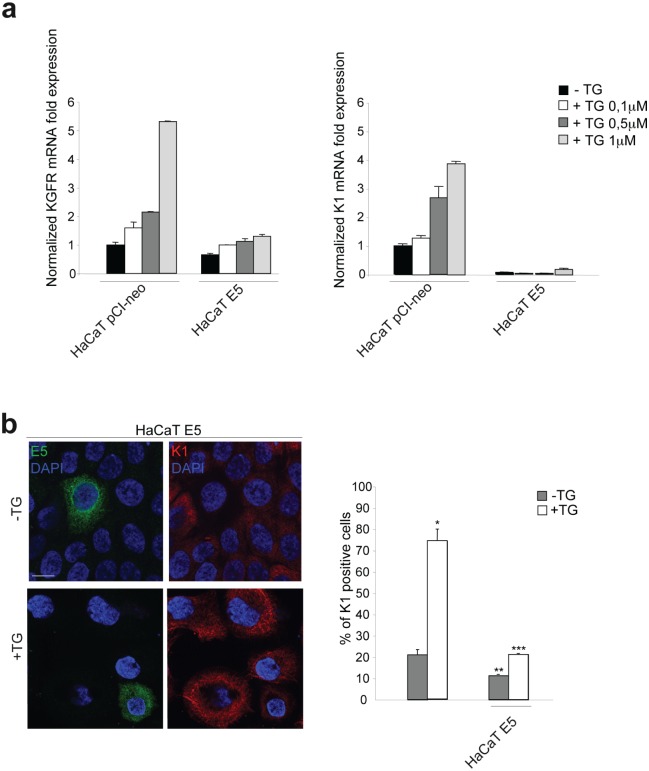
Figure 2. 16E5 down-regulates KGFR and K1 at both transcript and protein levels in TG-treated differentiating keratinocytes.
(a) HaCaT pCI-neo and HaCaT E5 cells were treated with different doses of TG (0.1μM, 0.5μM and 1μM) for 1h at 37°C. Cells treated with equal amount of DMSO solvent were used as a control. KGFR mRNA (left panel) and K1 mRNA (right panel) transcript levels were quantitated by real-time relative RT-PCR: a clear inhibition on KGFR and K1 transcription is found at all TG doses in HaCaT E5 cells compared to HaCaT pCI-neo cells. (b) HaCaT E5 cells were treated with TG 1μM as above, while the control cells were kept in DMSO alone. Double immunofluorescence was performed using anti-HA monoclonal antibody, to visualize 16E5 protein, and anti-K1 polyclonal antibodies. 16E5 staining is localized in cytoplasmic reticular structures, while K1 staining appears cytosolic and filamentous. The K1 signal is decreased in cells expressing 16E5 in both TG-untreated and TG-treated cultures. Cell nuclei were visualized by DAPI. Quantitative immunofluorescence analysis shows that the decrease of the percentage of K1 positive cells induced by 16E5 expression was particularly evident in TG-treated compared to TG-untreated cultures. The quantitative analysis was assessed by counting for each sample a total of 50 cells, randomly observed in 10 microscopic fields from three different experiments. Cut-off of the K1 signal intensity was determined for TG-treated and control samples as described in Materials and Methods. Results are expressed as mean values ± standard errors (SE). Student's t test was performed and significance level has been defined as p<0,05: *p<0,001 vs the corresponding untreated cells; **p<0,01 vs the corresponding surrounding cells that do not show E5 expression; ***p<0,01 vs the corresponding surrounding cells that do not show E5 expression. Bar: 10 μm

