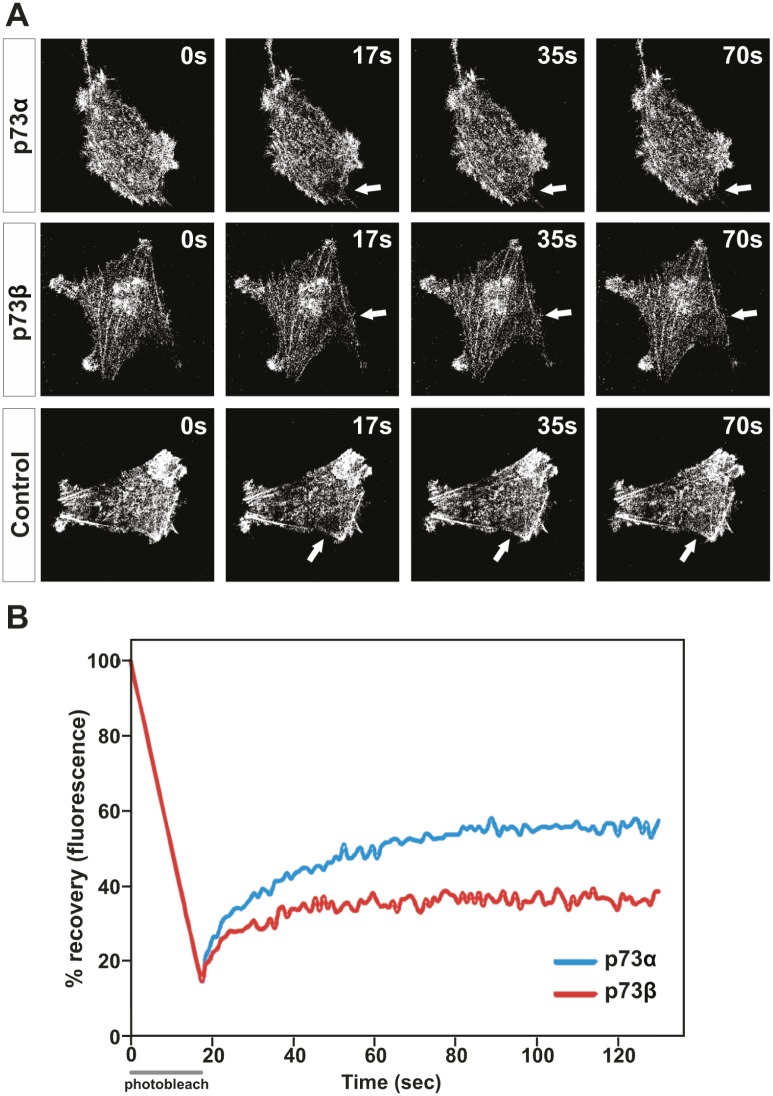
Figure 3. Actin cytoskeleton dynamics are impaired in p73β-expressing cells.
HeLa cells were transfected with expression vector encoding for p73α or p73β, and compared with control cells transfected with the corresponding empty vector. The mobile actin fraction in p73α-, or p73β-expressing HeLa cells was measured by FRAP analysis of cells co-transfected with actin-GFP to visualize the actin cytoskeleton. Values represent the % fluorescence recovery over time of actin-GFP after bleaching. Arrows indicate the photobleached area (A). For every FRAP experiment 3-7 cells per condition were used. Average of three independent experiments is presented in the figure (B).

