
FIGURE 3. ERα and its phosphorylated forms are downregulated by FTS in ECC1 and USPC1 cell lines.
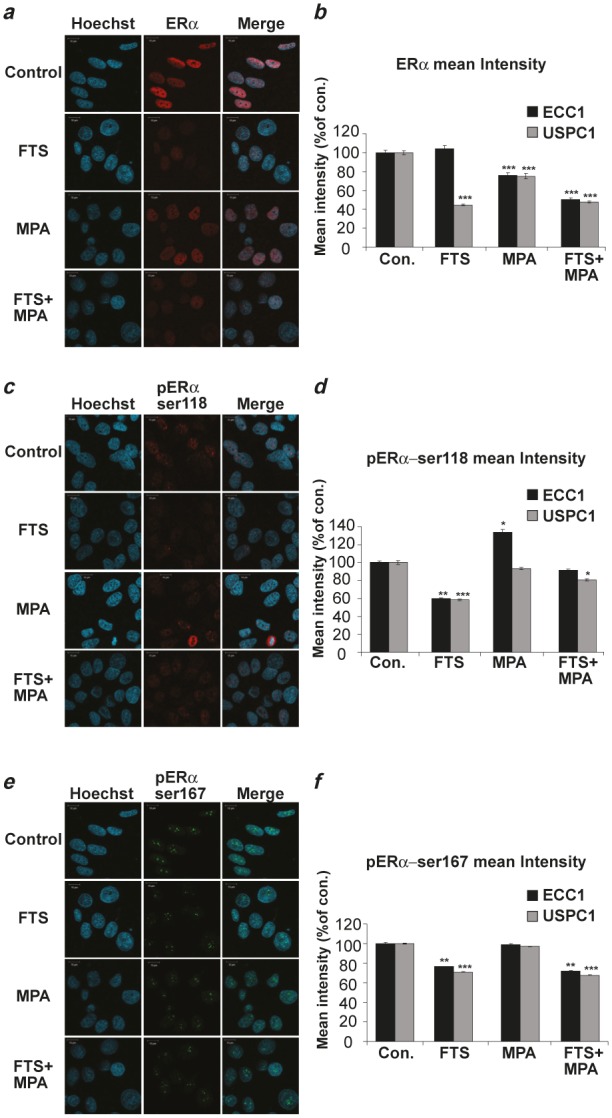
ECC1 and USPC1 cells were plated on glass cover slips in 6-well plates. After 24 hr the media were replaced with 0% FCS media (starvation). After 16 hr the cells were treated with FTS, MPA, FTS + MPA (concentrations as in Fig. 2), or 0.1% DMSO (control). Three hours after treatment the cells were stained with anti-ERα, anti-pERαSer118 or anti-pERαSer167 antibodies in an immunofluorescence experiment and subjected to confocal microscopy. Typical images of USPC1 cells stained with (a) anti-ERα antibody, (c) anti-pERα Ser118 antibody, and (e) anti-pERα Ser167 antibody are shown. Hoechst stain (blue) was used for nuclear staining. Statistical analysis of mean fluorescence intensity of (b) ERα (d) pERαSer118, and (f) pERαSer167 are presented as percentages of control (DMSO-treated) ECC1 and USPC1 cells (means ± SEM, n = 100). ERα was located mainly in the nucleus, not in the cytoplasm. FTS significantly reduced phosphorylation of Ser118 and of Ser167, while MPA caused a decrease in total ERα in USPC1 cells but not in the phosphorylated forms. These findings correlated with the results showing that FTS, but not MPA, downregulates pathways of active Ras signaling. *, ** and *** are compared with the control for each cell line. *p < 0.05, ** p < 0.01, ***p < 0.001. Con, control; ERα, estrogen receptor alpha; FTS, S-farnesylthiosalicylic acid; MPA, medroxyprogesterone acetate; Ser, serine.