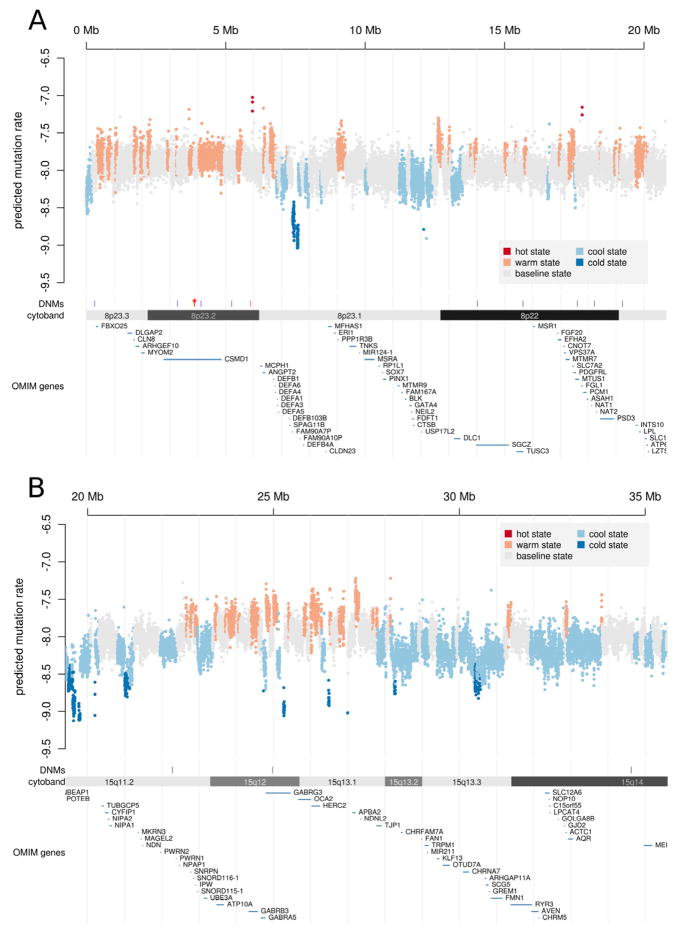
Figure 5. Landscape of mutability in the genome.
(A) The 1 kb average mutability index (MI) across a 20 Mb genomic region of chromosome 8p21–23 indicates the existence of extended regions of hypermutability. “Hotspots” (red), “warm spots” (orange) as well as “cold spots” were defined by segmenting the MI scores using a 5 state HMM (see Supplemental Table 7). Predicted mutation rates (y-axis) were computed by multiplying the arithmetic mean MI by the baseline mutation rate of 10−8, then transforming to the log10 scale. The genome- and exome-wide distributions of MI are depicted in Supplemental Figure 7. The locations of DNMs are also shown and include a dense cluster of DNMs from individual 74–0355 (red, DNMs < 100 kb apart marked by asterisk). (B) The lower panel displays segmentation results for a second genomic region at 15q11–13. This region is notable for having a high rate of recurrent structural mutation. In the same region, the predicted rate of nucleotide substitutions is highly elevated.

