
Figure 6. U-shaped relationship of mutability and evolutionary conservation.
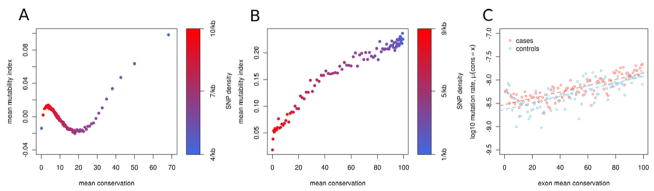
(A) Throughout the genome, we observe a correlation of hypermutability, hyperdivergence and hyperdiversity, consistent with previous studies. By contrast, in highly conserved regions the opposite trend is evident. MI and conservation were averaged in 1kb windows genome-wide. Windows were then binned according to percentiles of conservation. (B) Specifically within exons, there is a strong positive correlation of mutability and evolutionary conservation (also binned by percentiles of conservation). (C) The positive correlation between mutation rate and average exon conservation was confirmed by data from exome studies. Note that the positive relationship exists for both cases and controls. Under the null hypothesis, in which exons are hit with probability proportional to their length, this relationship is not observed.