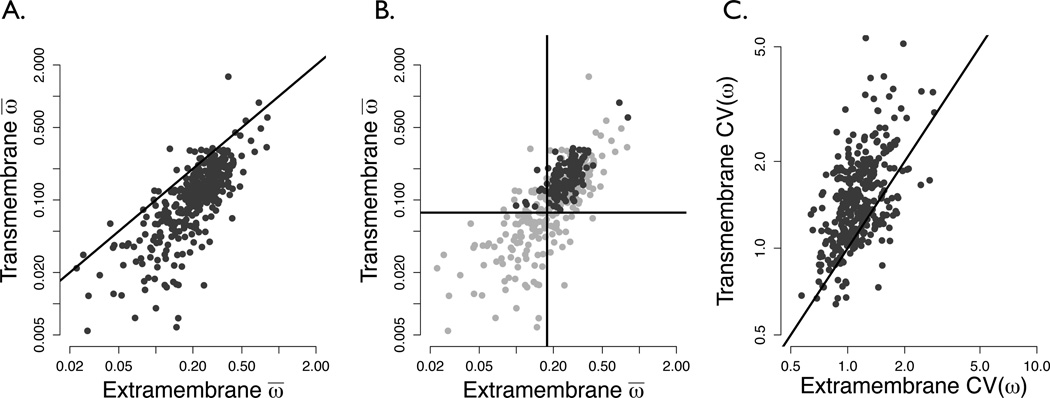
Figure 1.
(a) TM ω̄ plotted against EM ω̄ , both calculated by the REL model, shown on a log-log scale for all 359 proteins. The solid line indicates points where the EM rate equals that of the TM. The vast majority of proteins lie below this line (exact binomial test p < 10−15), showing that TM domains evolve slower than EM domains. (b) Average TM ω plotted against average EM ω, showing different types of GPCRs, on a log-log scale. Dark gray points represent chemosensory receptors, and light gray points non-chemosensory receptors. Vertical and horizontal lines lie at the mean of nonchemosensory TM and EM average rates, respectively. The majority of chemosensory points lie fall in the top-right quadrant of this plot (exact binomial test p = 6.85 × 10⁻⁴), indicating their elevated evolutionary rate relative to non-chemosensory receptors. (c) Regression of TM against EM coefficients of variation of ω values [CV(ω)] on a log-log scale. If the spread of rates between partitions were equal, all points would lie roughly on the x = y line shown. However, the majority of points lie on the TM side of the line, demonstrating the increased rate heterogeneity in TM domains of receptors proteins. This shift is highly significant at p < 10−15 by the exact binomial test.

