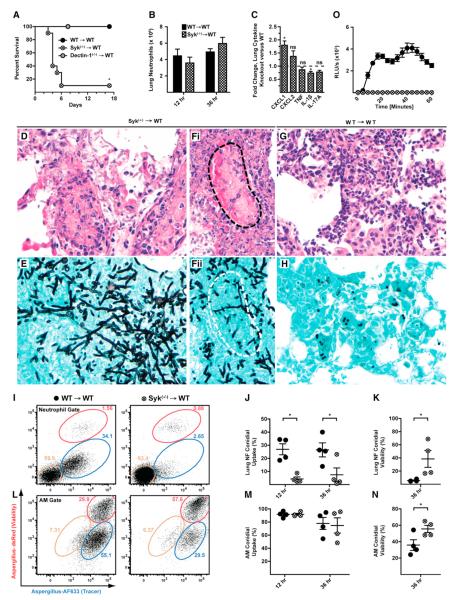
Figure 5. Syk and Neutrophil Function during Respiratory Fungal Infection.
(A–N) Syk(−/−) → WT (hatched circles or bars) and WT → WT (black circles or bars) mice were infected with (A and D–H) Af293 or (B, C, and I–N) FLARE conidia and euthanized at the indicated times p.i.
(A) Kaplan-Meier survival plot of Syk(−/−) → WT (n = 10), Dectin-1(−/−)→ WT (n = 5), and WT → WT (n = 10) mice challenged with 2–5 × 10⁷ conidia. The data are pooled from two experiments.
(B and C) The bar graphs show the average (±SEM) (B) lung neutrophil recruitment and (C) lung cytokines at 36 hr p.i. Lung cytokine data are expressed as the fold change in the (−/−) response compared to the (+/+) response pooled from two experiments, each with three to four mice per group.
(D–H) Representative micrographs of H&E (D, Fi, and G) and silver-stained (E, Fii, and H) lung sections from Syk(−/−) → WT (D, E, Fi, and Fii) and WT → WT (G and H) mice (40×). The dotted lines (black in Fi and white in Fii) show a blood vessel infiltrated by hyphae.
(I and L) Representative flow cytometry plots are gated on WT (left column) or Syk(−/−) (right column) (I) lung neutrophils or (L) AMs and analyzed as described in Figure 4.
(J, K, M, and N) The scatterplots indicate the mean (±SEM) (J and M) conidial uptake and (K and N) conidial viability in Syk(−/−) and WT, (J and K) neutrophils, and (M and N) AMs. Data from one of two experiments are shown.
(O) ROS generation by BM neutrophils isolated from WT → WT and Syk(−/−) → WT mice and stimulated with swollen conidia. Data are expressed as RLU/s (×103) (mean ± SEM).
*p < 0.05 (Mann-Whitney U test). See also Figure S5.

