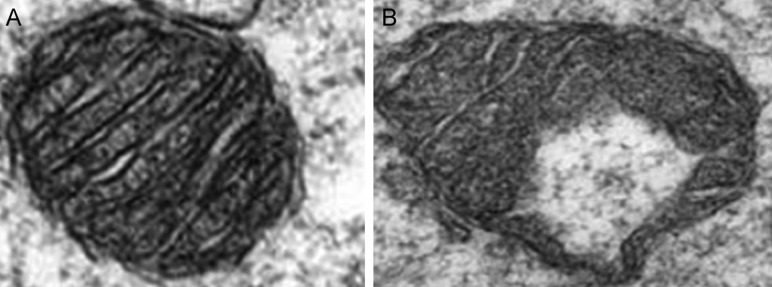
Figure 3.
Oocyte mitochondrial ultrastructure. Compared with the mitochondria from oocytes of mice on a control diet (A), the mitochondria from oocytes of mice from the HFD group (B) have fewer cristae, increased cristae disarray, decreased electron density of the mitochondrial matrix, increased swelling and a greater number of vacuoles. Reproduced with permission from Luzzo et al. (2012).

