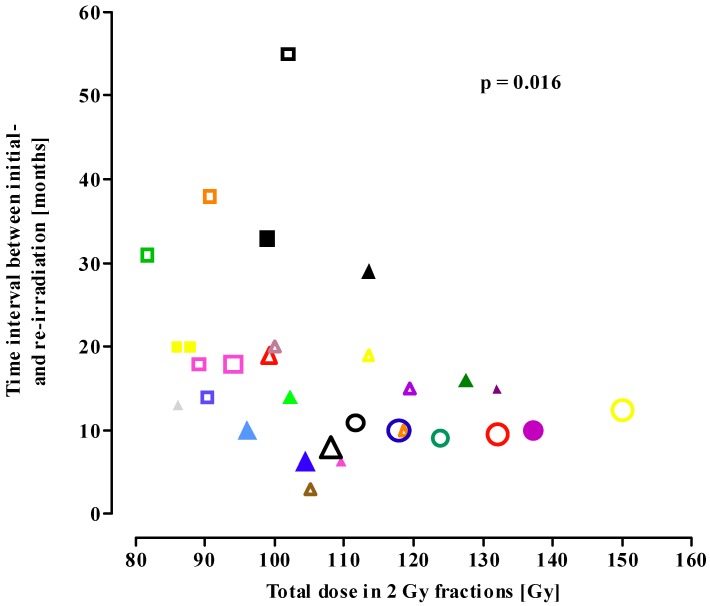
Figure 1.
Total dose in 2 Gy fractions (EQD2cumulative) as a function of the time interval between initial treatment and conventional re-irradiation (squares), fractionated stereotactic radiotherapy (triangles) and stereotactic radiosurgery (circles). Open symbols: none of the patients in the study showed brain necrosis; solid symbols: patient(s) with radionecrosis in the study. Symbol size represents the number of patients in the study. Small-sized symbol <25 patients; median-sized symbol 26–50 patients; large-sized symbol >50 patients. Symbols in the figure match the symbols used in Table 1, Table 2, Table 3. (Spearman nonparametric correlation: p = 0.016).

