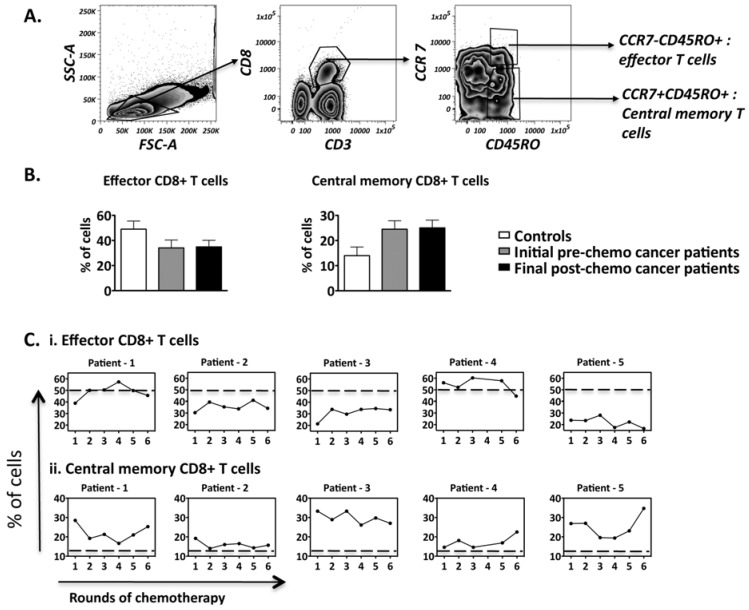
Figure 2.
Frequencies of CD8+ T cell subsets present within the peripheral blood of ovarian cancer patients over the course of chemotherapy. Flow cytometry was performed on PBMCS isolated from patients (n = 5) and controls (n = 6). (A) The gating strategy employed to identify effector and central memory CD8+ T cells; (B) Comparison of the CD8+ T cell subset frequencies between controls and patients; pre-chemo representing 0 rounds while post-chemo represents 6 rounds of chemotherapy; (C) Frequency fluctuations of CD8+ T cell subsets of patients over the course of chemotherapy. The dotted line represents the mean frequency of the healthy controls. Comparison of CD8+ T cell subset frequencies between controls and patients: not significant.

