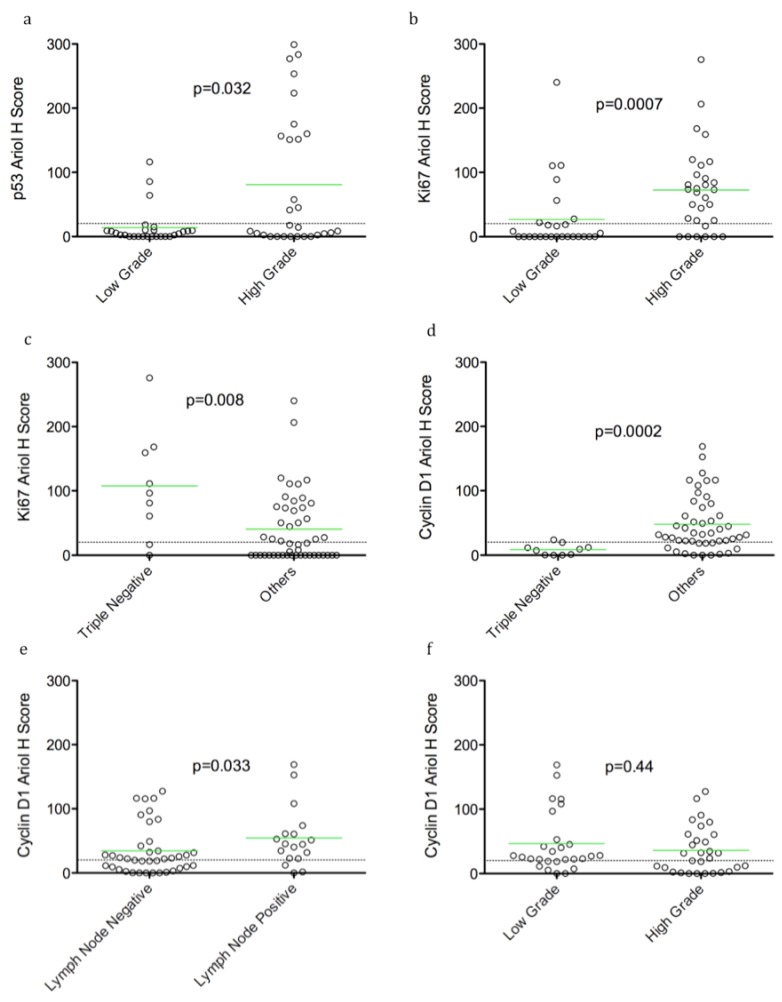
Figure 2.
Selected dot plots of associations of p53, Ki67 and cyclin D1 with clinico-pathological parameters Dot plots of Ariol H scores of p53 (a), Ki67 (b,c) and cyclin D1 (d–f) versus selected clinico-pathological parameters are shown. Significance between groups was determined using an exact Wilcoxon rank sum test, as described in Materials and Methods (p value indicated). Bars indicate the mean H score in each group, and the dotted line indicates the threshold for positive versus negative stain based on dichotomized data. Statistical analysis was performed as in Figure 1. Examples of significant biomarker associations with indicated clinico-pathological parameters are shown (a–e). An example of no correlation of cyclin D1 with grade is shown for comparison (f).

