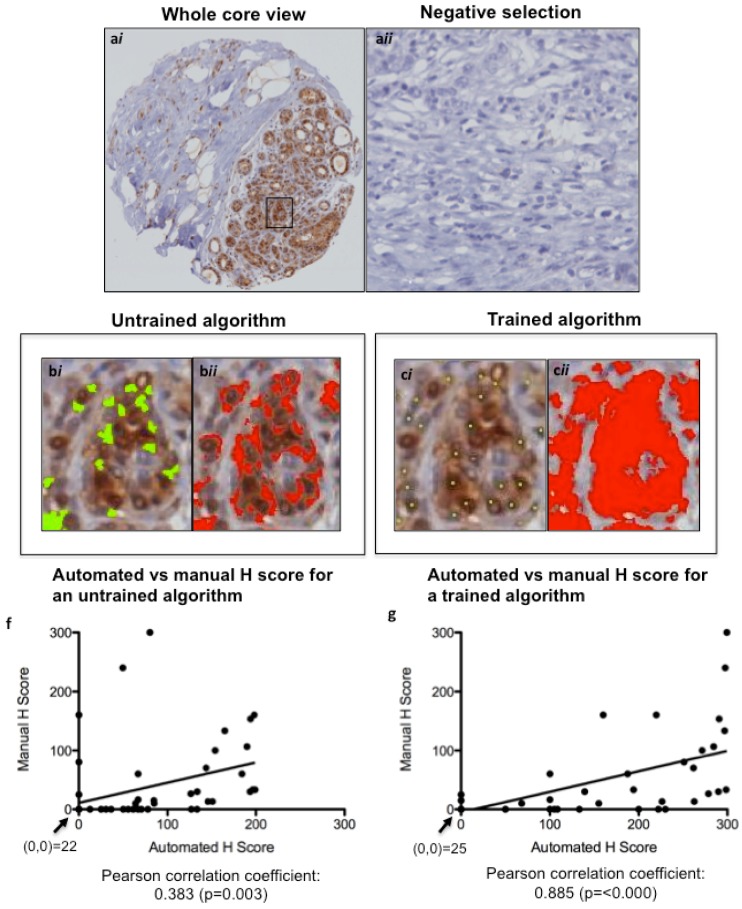
Figure 3.
Optimizing Ariol Software for pERK IHC scoring. A TMA slide immunostained for pERK was scanned into the Ariol Sl-50 slide scanner (a) and a nuclear analysis was done without (b) or with (c) training based on size/shape characteristics (bi, bii) and color (ci, cii). The same cores were scored manually by two pathologists. The untrained (d) and trained (e) automated H scores were each plotted against the “gold standard” manual H Scores, and a Pearson correlation coefficient (with p value) was calculated. A linear regression line of best fit is shown. The values at the origin in each plot are indicated. (a), 200× magnification; (b and c), 600× magnification.

