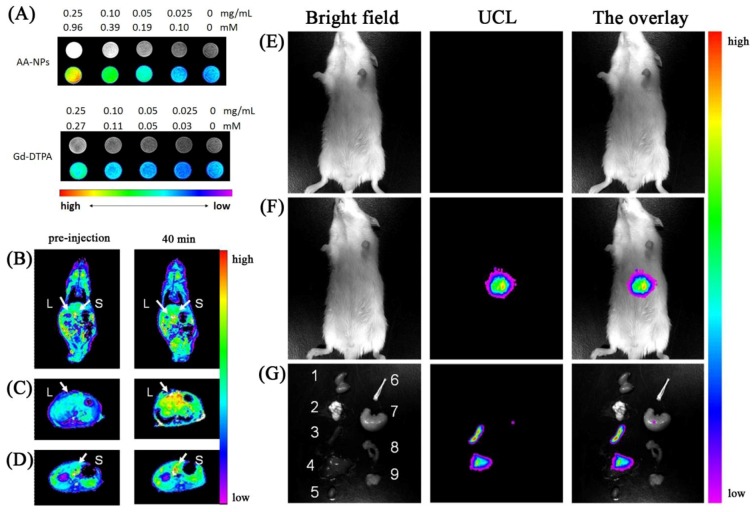
Figure 18.
(Left column, A): T1-weighted and color-mapped MR images for different mass and molar concentrations of (top) AA-NPs and (bottom) Gd-DTPA. (Left column-bottom): Color-mapped (B) coronal images of the whole body and (C, D) transversal cross-sectional images of the liver (L) and spleen (S) of mice at pre-injection and at 40 min after intravenous injection of AA-NPs. (Right column): In vivo imaging of mouse after intravenous injection (E) with and (F) without AA-NPs. (G) images of dissected organs of a mouse sacrificed 40 min after intravenous injection with AA-NPs. 1, kidney; 2, lung; 3, spleen; 4, liver; 5, heart; 6, bone; 7, stomach; 8, intestines; 9, muscle ([117], reproduced by permission of Elsevier).

