
Fig 1. Correlation between Hgb and TT4, TT3 and CRP levels at presentation.
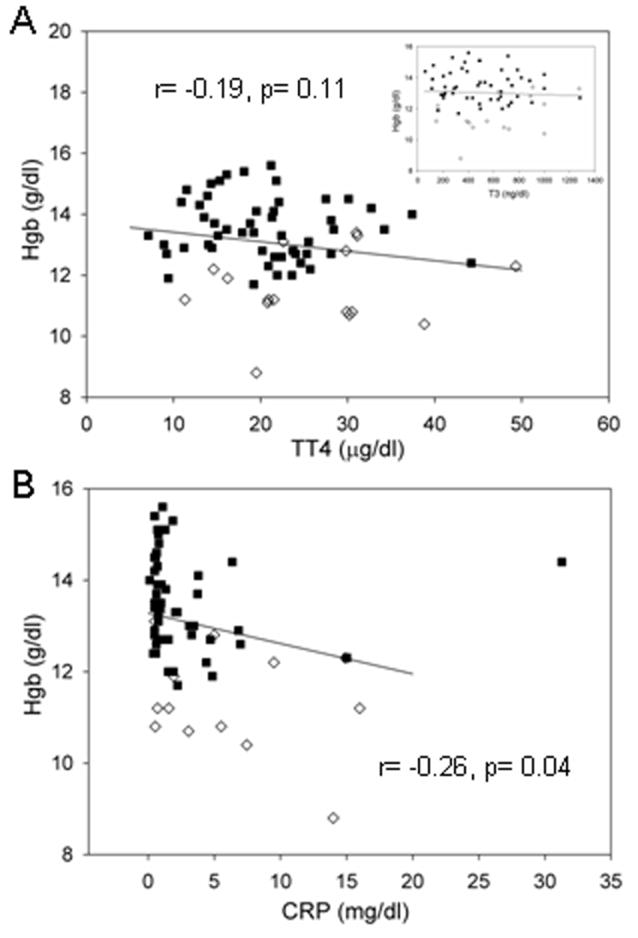
Scatter plot 1A displays the Pearson correlation (Spearman correlation= -0.19, P=0.12) between Hgb and TT4 levels [T3 in insert] in GD anemic (◇) and non-anemic (■) subjects. The Pearson correlation between Hgb and CRP levels in these subjects is displayed in scatter plot 1B. [Spearman correlation= -0.38, P=.002].