
Fig 2. Correlation between changes in Hgb and TT4, TT3 and CRP levels following successful therapy.
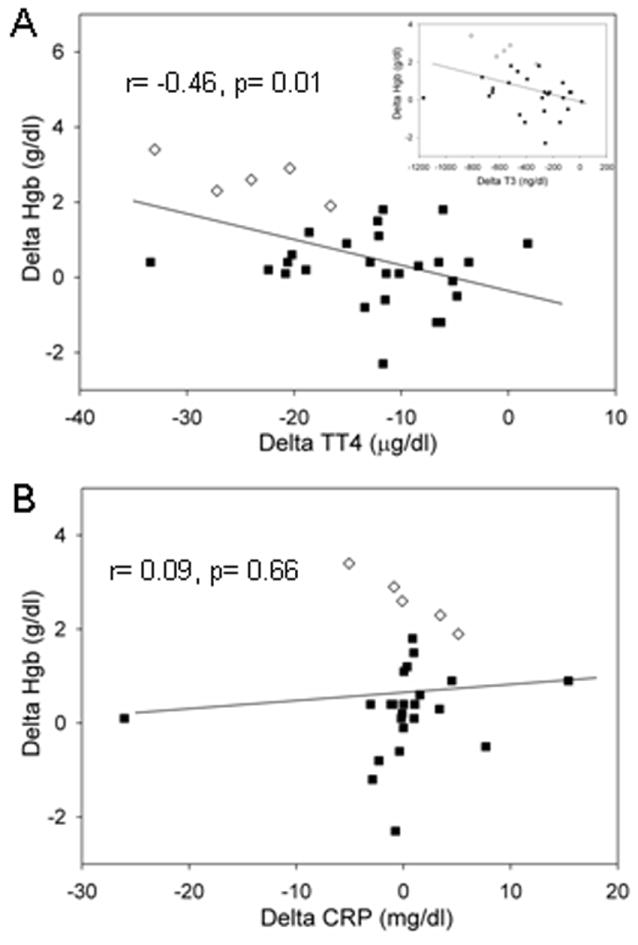
Scatter plot 2A displays the Pearson correlation (Spearman correlation= -0.42, P=0.02) between change (delta) in Hgb and TT4 levels [T3 in insert] of GD anemic (◇) and non-anemic (■) subjects. Scatter plot B displays the Pearson correlation (Spearman correlation= 0.25, P=0.20) between change (delta) in Hgb and CRP levels in these subjects.